
3Q2021 NIC Analytics Demand Pulse Metric
December 22, 2021
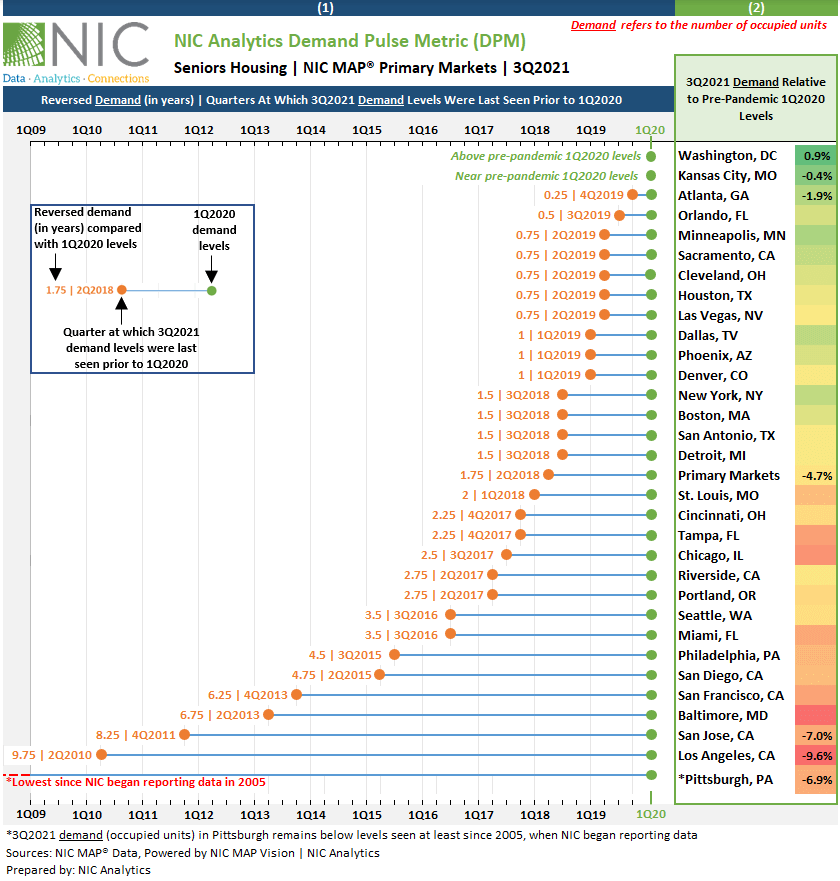
This blog features the NIC Analytics Demand Pulse Metric (DPM) for third quarter 2021 (3Q2021), a measure that examines senior housing demand (occupied units) for the NIC MAP® 31 Primary Markets and provides a window into the strength of a market based on occupied stock trends. The demand pulse metric pinpoints when 3Q2021 demand levels were last seen before the pandemic began to influence the senior housing sector in 1Q2020 and tracks demand growth and progress across the 31 Primary Markets.
Aggregate Market Demand Pulse
Third quarter 2021 NIC MAP® data, powered by NIC MAP Vision, showed the largest improvement in demand in a single quarter since NIC MAP® began to report the data in 2005. For the 31 Primary Markets, 12,318 units were absorbed on a net basis, a 2.3% increase from the prior quarter. This pushed occupied units back to their 2Q2018 level. Said another way, it was 1.75 years (7 quarters) ago – counting back from pre-pandemic 1Q2020 levels – that occupied units equaled the level achieved in 3Q2021. Prior to the 3Q2021 jump in net absorption, occupied units had only recovered to their 2Q2017 levels (2.75 years or 11 quarters, counting back from pre-pandemic 1Q2020 levels). And while a very welcomed improvement, 3Q2021 occupied stock was still 4.7% below pre-pandemic 1Q2020 levels.
The DPM Exhibit below provides a visual of these metrics for the Primary Markets as well as the individual metropolitan markets that comprise the aggregate measure.
Market-Specific Demand Pulse
Based on the positive momentum in net absorption patterns in 3Q2021, the level of occupied units in both Washington, D.C. and Kansas City had returned to 1Q2020 pre-pandemic levels. In fact, the level of occupied units in Washington exceeded pre-pandemic levels by 0.9%, while demand in Kansas City was near 1Q2020 levels and fell short by only 55 units, equivalent to a gap of merely 0.4% compared with 1Q2020 levels.
There were 10 markets where occupied units in 3Q2021 were at levels seen as recently as one year ago or less compared with 1Q2020 levels. This includes Atlanta (3Q2021 demand was the same as in 4Q2019 and remains 1.9% below 1Q2020 levels), Orlando (same as 3Q2019); Minneapolis, Sacramento, Cleveland, Houston and Las Vegas (same as 2Q2019); Dallas, Phoenix and Denver (same as 1Q2019).
Despite the recent improvements in demand across all the 31 Primary Markets, the level of occupied units in 3Q 2021 remains far below 1Q2020 levels. This is the case for Pittsburgh, where the number of occupied units remains below levels reported since at least 2005, when NIC began reporting data. Similarly, the number of occupied units in Los Angeles remains below 1Q2020 levels by almost 10 years and is now at levels seen in 2Q2010, and San Jose remains eight years below 1Q2020 levels and is now at levels seen in 4Q2011. Notably, 3Q2021 demand relative to 1Q2020 levels in Los Angeles stood at negative 9.6%, while 3Q2021 demand in San Jose and Pittsburgh remains 7.0% and 6.9% below 1Q2020 levels, respectively.
This analysis suggests that factors that influence demand are stronger in some markets than in others and that there will be some markets that will return to pre-pandemic demand levels sooner while others will take longer. Separately, and not surprisingly, a recent analysis by NIC Analytics looked at the share of same-store properties within individual metropolitan markets that had reached their pre-pandemic occupied unit levels and found that the demand recovery paths and timelines for properties also varied significantly. Hence as property performance goes, so goes broader metropolitan area performance.
In summary, positive senior housing demand momentum was evident in both the 2Q2021 and 3Q2021 NIC MAP® data after four consecutive quarters of pandemic-related weak demand. The upcoming 4Q2021 NIC MAP® Quarterly Data Release on January 6, 2022, will showcase if the demand recovery continued to expand or slowed down, and which other markets have fully returned to pre-pandemic 1Q2020 demand levels and which ones continued to lag.
Exhibit: 3Q2021 NIC Analytics Demand Pulse Metric
Interested in learning more about NIC MAP®️ data? To learn more about NIC MAP data, powered by NIC MAP Vision, schedule a meeting with a product expert today.
—-
This blog was originally published on NIC Notes.
About NIC
The National Investment Center for Seniors Housing & Care (NIC), a 501(c)(3) organization, works to enable access and choice by providing data, analytics, and connections that bring together investors and providers. The organization delivers the most trusted, objective, and timely insights and implications derived from its analytics, which benefit from NIC’s affiliation with NIC MAP Vision, the leading provider of comprehensive market data for senior housing and skilled nursing properties. NIC events, which include the industry’s premiere conferences, provide sector stakeholders with opportunities to convene, network, and drive thought-leadership through high-quality educational programming. To see all that NIC offers, visit nic.org.
NIC MAP Vision gives operators, lenders, investors, developers, and owners unparalleled market data for the seniors housing and care sector.