
Are Senior-Housing Markets Oversupplied or Overlooked?
April 28, 2017
The Senior-Housing industry is growing rapidly, and the competition for prospective residents is becoming more intense every day. The number of senior-housing facilities currently on the market is growing at an increasing rate and occupancy rates are slowly declining. For this reason, oversupply has become a buzzword in many boardrooms and at conferences across the United States. The question is why? Is supply vastly out growing demand across the nation or is new supply being built in the wrong markets because demand is being underestimated?
Another buzzword common to the space is the ‘Silver Tsunami,’ or more politely put, the baby boomers’ shift towards retirement age. We all know a significant portion of the population is aging, which also means expected growth in demand for services for the elderly. We also know that an unfortunate part of this demographic shift includes an increase in disability affliction rates, especially for diseases such as Alzheimer’s.
According to the Alzheimer’s Association, more than 5.3 million individuals were afflicted by Alzheimer’s in 2016, and that number is expected to grow to 7.2 million by 2025, a 30% increase. But if you look closer, which the Alzheimer’s Association did, and you look at the numbers by state – the variance is significant.
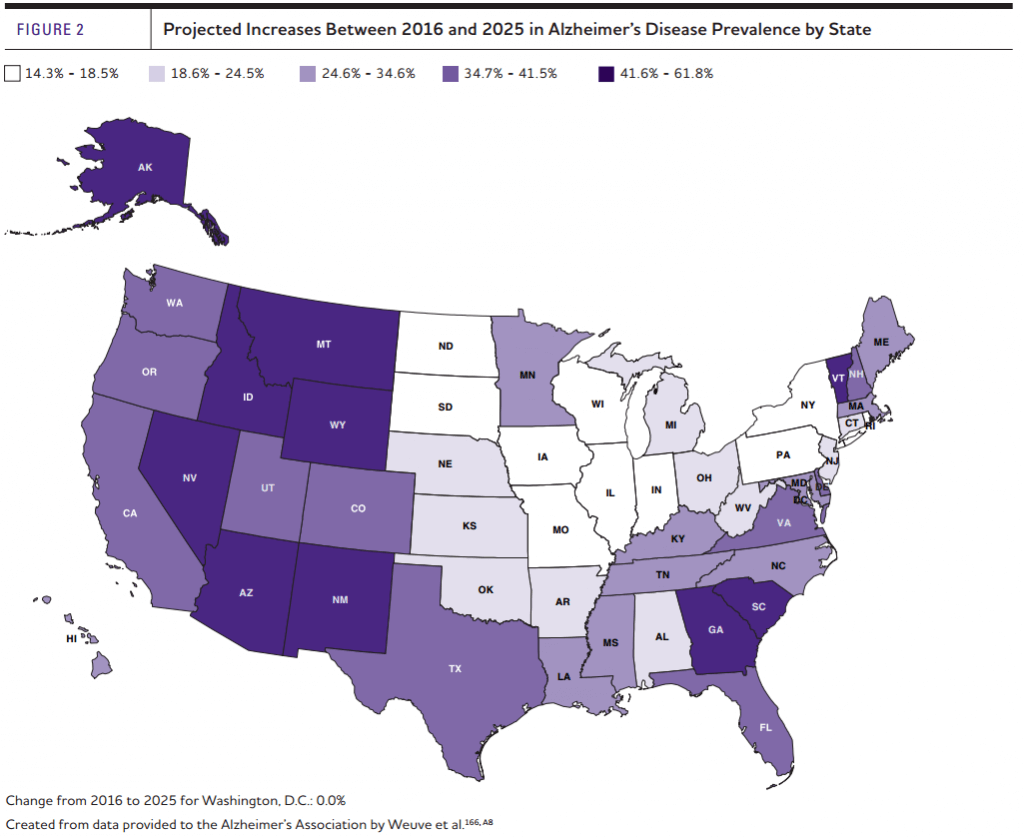
First, let’s juxtapose the five states expected to have the highest and lowest growth rates in Alzheimer’s. The five states with the highest expected growth rates are: Alaska, Nevada, Arizona, Georgia, and Idaho. On average, these states are expected to experience growth of 52.3% in the rate of Alzheimer’s between now and 2025. Including the District of Columbia, the five states with the lowest expected growth rates are, Washington, D.C., North Dakota, Iowa, Rhode Island, and South Dakota. These states are expected to experience growth of 13.8% in the rate of Alzheimer’s. This means the five fastest growing states are expected to experience 2.8 times as much growth as the five states with the lowest expected growth rates.
(Please note that I calculated the following affliction rates by dividing the Alzheimer’s Association’s projected per state afflicted population by the census bureau’s 2016 per state population estimates).
When we look at affliction rates, the difference between the five states with the highest affliction rates and the lowest affliction rates are also significant. Utah, Colorado, Texas, Georgia and Washington, D.C. are the five states with the lowest affliction rates, averaging 1.2% of total population. The five states with the highest affliction rates are Florida, Rhode Island, Pennsylvania, Connecticut, and West Virginia; which have an average affliction rate of 2.2% or 80% more than the five lowest states.
Beyond the fact that this disease is terrifying, this variance is incredibly interesting. Market studies for memory care facilities often calculate demand using income qualifying thresholds for various age brackets, actual or expected penetration rates within the market, and occasionally the affliction rate of dementia is considered. However, most studies use the national average affliction rate instead of the true rate in their subject’s primary market area. But why do we use national averages when there is a clear variance across the U.S.? Does it not make more sense to consider the affliction rate of Alzheimer’s and other cognitive disabilities within the subject’s primary market area? Why not consider the number of dementia prescription beneficiaries, or the total cost of dementia related medications, or even the cognitive disability rates for the subject’s market area to determine the need and demand for memory care services?
At VisionLTC, we’ve analyzed over fifty market feasibility studies and compared how industry professionals approach the challenge of calculating unmet demand for memory care services. We found that most of the industry uses similar methodologies to calculate demand, and very few include any data relating to dementia. To start a dialogue within the industry, we prepared two methodologies that are based on the number of dementia medication beneficiaries within a market area to see if the results would be comparable to current standards.
The first methodology we prepared [VisionLTC 1] assumes that demand for MC beds is based on a percentage of individuals already receiving medication for dementia, that number is then adjusted to account for prospects outside the market area and then subtracts existing MC supply and construction.
The second methodology we prepared [VisionLTC 2] multiples the VisionLTC 1 formula by the percentage of income qualified 75+ households.
Below are the formulas of the five methodologies.
Industry 1 – Income Based
MC Demand = (Income qualified 75+ population * forecasted market penetration rate)
Industry 2 – Income Based
MC Demand = (0.5 * Income qualified 75+ Households * Penetration Rate) + (0.5 * Adult Child 45-64 Households * Penetration Rate) * MC Services Ratio – Existing MC Supply and Construction
Industry 3 – Income Based
MC Demand = Average [(60-74 Population * 60-74 Penetration Rate), (75+ Population * 75+ Penetration Rate), (Income Qualified 75+ Households * IQ 75+ Households Penetration Rate), (Adult Child Households * Adult Child Household Penetration Rate)] * MC Services ratio – MC Supply
VisionLTC 1 – VisionLTC Dementia Based
MC Demand = ((# of Dementia Beneficiaries * % Seeking Services) / (1 – Out of Market Factor)) – (MC Supply + MC Construction)
VisionLTC 2 – VisionLTC Income Qualified Demand Based
MC Demand = (Income Qualified 75+ Households/ Total 75+ Households) * [((# of Dementia Beneficiaries * % Seeking Services) / (1 – Out of Market Factor)) – (MC Supply + MC Construction)]
We calculated demand for 49 MSAs across the United States using these five methodologies, and ranked the outcomes based on their expected demand – the highest expected demand scored 1st and the lowest scored 5th. We found that the Industry 1 and VisionLTC 1 methodologies consistently ranked 1st or 2nd in terms of expected demand for the MSAs. This is primarily due to their broad approach to demand (Industry 1) or lack of an income threshold (VisionLTC 2).
| Unmet Demand | Average Rank |
| Industry 1 | 2.5 |
| Industry 2 | 3.5 |
| Industry 3 | 4.7 |
| VisionLTC 1 | 1.4 |
| VisionLTC 2 | 2.8 |
The VisionLTC 2, Industry 2 and Industry 3 methodologies returned more conservative and consistent results than the other approaches. The VisionLTC 2 approaches consistently ranked 3rd in terms of expected demand and considered both the need for services and the ability to pay for them. The Industry 2 and Industry 3 methodologies also considers the ability to pay for services, and then assumes that demand for memory care services is some function of assisted living services. It is our opinion that these three approaches are superior to the previously mentioned methodologies.
But why does this matter when we’re talking about oversupply? Well the methodology used in a project’s feasibility study often determines, or at least influences, the accept/reject decision for the project. If demand calculations are overly zealous, then projects will be approved and built when the underlying market may not be able to support them. If demand calculations are overly conservative, then entire markets may be incorrectly ignored and undersupplied. It may be time for Senior-Housing to refresh its approach to market analysis and take into consideration all the data available to them.
NIC MAP Vision gives operators, lenders, investors, developers, and owners unparalleled market data for the seniors housing and care sector.