
CCRC Care Segment Performance Trended Lower But Better Than Non-CCRCs in 1Q 2021
May 21, 2021
The NIC MAP® Data Service, powered by NIC MAP Vision, tracks occupancy, asking rents, demand, inventory, and construction data for independent living, assisted living, memory care, skilled nursing, and continuing care retirement communities (CCRCs—also referred to as life plan communities) for more than 15,000 properties across 140 metropolitan areas. NIC MAP data currently tracks 1,208 not-for-profit and for-profit entrance fee and rental CCRCs in these 140 combined markets (1,134 in the 99 combined Primary and Secondary Markets).
The following analysis examines current conditions and year-over-year changes in inventory, occupancy, and same-store asking rent growth—by care segments within CCRCs (CCRC segments) compared to non-CCRC segments in freestanding or combined communities to focus a lens on the relative performance of care segments within CCRCs.
Current CCRC Occupancy by Payment Type and Profit Status
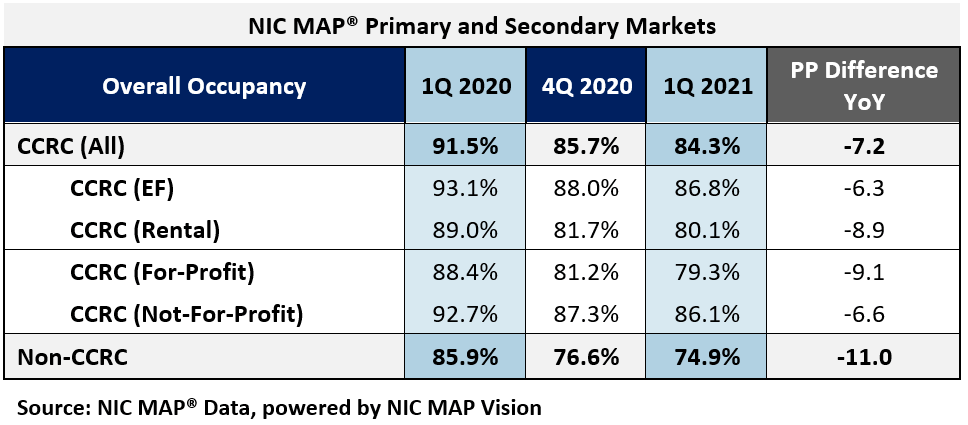
In the first quarter of 2021, CCRC occupancy fell 1.4 percentage points from the fourth quarter to 84.3%, another new low since NIC MAP began reporting in 2006. The cumulative drop in CCRC occupancy was 7.2 percentage points year over year—3.8 percentage points higher than non-CCRCs.
Non-CCRC occupancy averaged 74.9% in 1Q 2021—a very wide 9.4 percentage points lower than CCRC occupancy (84.3%). Entrance fee CCRC occupancy (86.8%) was 6.7 percentage points higher than rental CCRCs (80.1%), and not-for-profit CCRC occupancy (86.1%) was 6.8 percentage points higher than for-profit CCRCs (79.3%).
CCRCs vs. Non-CCRCs: Care Segment Detail
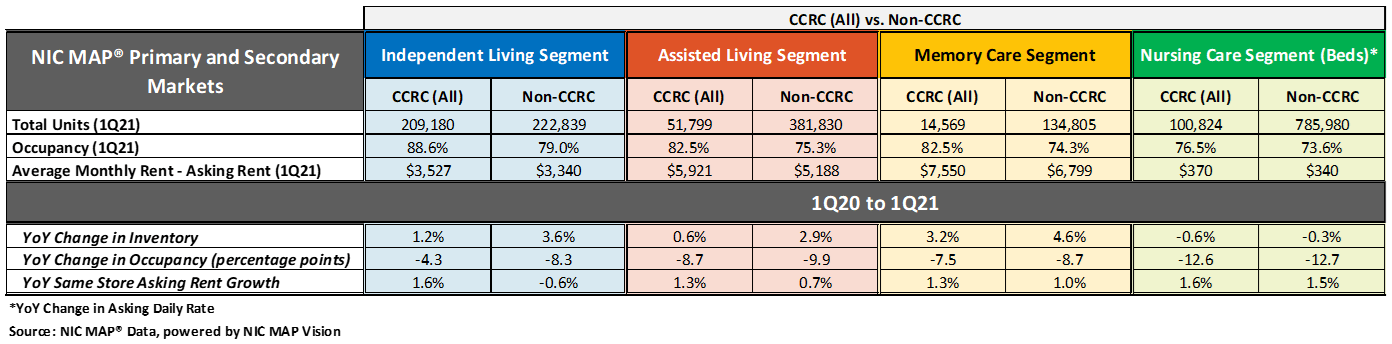
The table below compares each of the care segments—independent living, assisted living, memory care, and nursing care—in the Primary and Secondary Markets. The table shows the 1Q 2021 total open units, occupancy and average monthly asking rent—and year-over-year changes for CCRCs and non-CCRCs.
The CCRC independent living care segment (which represents 55.6% of CCRC units) garnered the highest occupancy in the first quarter of 2021 (88.6%), as well as the least year-over-year drop in occupancy falling 4.3 percentage points. The current nursing care segment occupancy rate in non-CCRCs, which represents 51.5% of non-CCRC units, was much lower at 73.6%, and fell 12.7 percentage points year-over-year.
Higher occupancy at CCRCs
The CCRC independent living care segment had the highest 1Q 2021 occupancy (88.6%), followed by CCRC assisted living and memory care (82.5%, respectively), and CCRC nursing care (76.5%). Among non-CCRCs, in the same order, the independent living care segment had the highest 1Q 2021 occupancy (79.0%), followed non-CCRC assisted living (75.3%), memory care (74.3%) and nursing care (73.6%).
The difference in 1Q 2021 occupancy between CCRCs and non-CCRCs was the highest for the independent living segment (9.6 percentage points), followed by the memory care segment (8.2 percentage points), the assisted living care segment (7.2 percentage points), and the nursing care segment (2.9 percentage points).
Occupancy declined from year-earlier levels for each of the care segments. However, CCRCs had lesser declines in occupancy than non-CCRCs. Among CCRCs, independent living care segment occupancy declined the least (-4.3 percentage points), followed by memory care (-7.5 percentage points), assisted living (-8.7 percentage points), and the nursing care segment (-12.6 percentage points). Among non-CCRCs, independent living and memory care segment occupancy declined the least (-8.3 and -8.7 percentage points, respectively), followed by assisted living (-9.9 percentage points), and the nursing care segment (-12.7 percentage points).
Higher annual, same store asking rent growth at CCRCs
Among CCRCs, the highest year-over-year asking rent growth was 1.6% in the independent living and nursing care segments; among non-CCRCs it was highest in the nursing care segment (1.5%). The lowest year-over-year asking rent growth was noted for CCRCs in the assisted living care segment (1.3%); in non-CCRCs it was noted for the independent living care segment (-0.6%). Note, these figures are for asking rates and do not consider any discounting that may be occurring.
Significantly weaker inventory growth at CCRCs
Non-CCRCs had higher rates of inventory growth (year-over-year change in inventory) by segment than CCRCs. The highest rates of inventory growth were reported for non-CCRCs in the memory care and independent living care segments (4.6% and 3.6%); the lowest were reported for both CCRCs and non-CCRCs in the nursing care segment (-0.6% and -0.3%, respectively). Negative inventory growth can occur when units/beds that are temporarily or permanently taken offline, or converted to another care segment, outweigh added inventory.
Occupancy rates vary by region and payment type
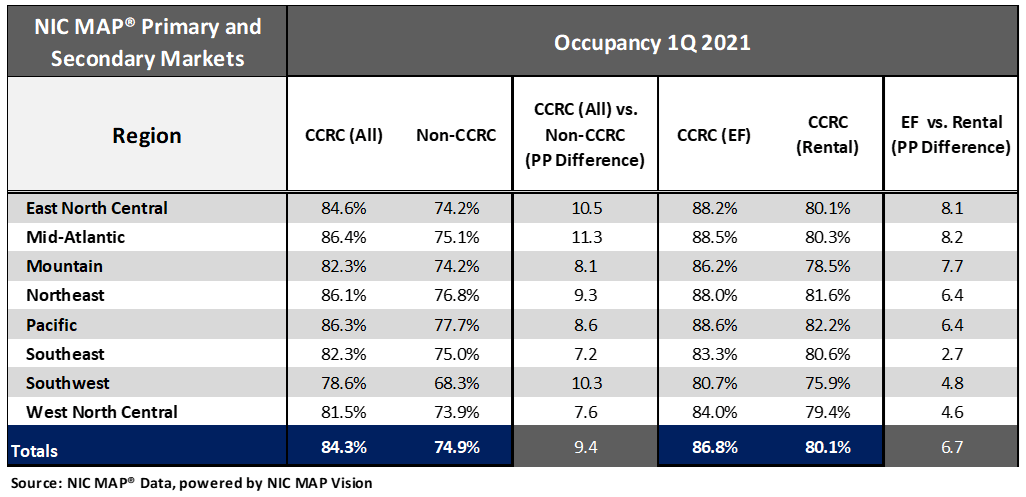
In the first quarter of 2021, the Mid-Atlantic, Pacific and Northeast regions have the strongest CCRC and non-CCRC occupancy rates ranging from 86.4% to 86.1% (CCRC) and 77.7% to 75.1% (non-CCRC). The weakest CCRC and non-CCRC occupancy is in the Southwest region at 78.6% and 68.3%, respectively. That said, the greatest difference in CCRC and non-CCRC occupancy was in the Mid-Atlantic region—an 11.3 percentage point difference.
Considering payment type, entrance fee occupancy was highest in the Pacific, Mid-Atlantic, East North Central, and Northeast regions (88.6% to 88.0%), whereas rental occupancy was the highest in the Pacific region (82.2%). The largest difference between entrance fee and rental occupancy was reported for the Mid-Atlantic and East North Central regions (8.2 and 8.1 percentage points, respectively).
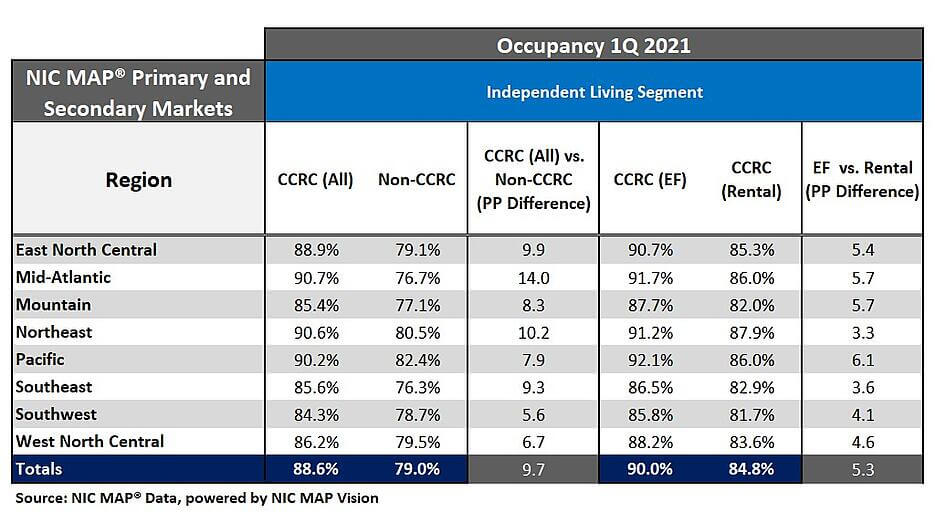
Looking specifically at the independent living care segment, the highest CCRC occupancy was in the Mid-Atlantic, Northeast and Pacific regions (90.7% to 90.2%), but the largest difference between CCRCs and non-CCRCs was in the Mid-Atlantic region (14.0 percentage points).
Considering payment type, entrance fee occupancy was highest in the Pacific region (92.1%), whereas rental occupancy was the highest in the Northeast region (87.9%). The largest difference between entrance fee and rental occupancy was reported for the Pacific region (6.1 percentage points).
Interested in learning more?
To learn more about NIC MAP data, powered by NIC MAP Vision, and about accessing the data featured in this article, schedule a meeting with a product expert today.
About Lana Peck
Lana Peck, a senior principal at the National Investment Center for Seniors Housing & Care (NIC), is a seniors housing market intelligence research professional with expertise in voice of customer analytics, product pricing and development, market segmentation, and market feasibility studies including demand analyses of greenfield developments, expansions, repositionings, and acquisition projects across the nation. Prior to joining NIC, Lana worked as director of research responsible for designing and executing seniors housing research for both for-profit and nonprofit communities, systems and national senior living trade organizations. Lana’s prior experience also includes more than a decade as senior market research analyst with one of the largest senior living owner-operators in the country. She holds a Master of Science, Business Management, a Master of Family and Consumer Sciences, Gerontology, and a professional certificate in Real Estate Finance and Development from Massachusetts Institute of Technology (MIT).
—-
This blog was originally published on NIC Notes.
About NIC
The National Investment Center for Seniors Housing & Care (NIC), a 501(c)(3) organization, works to enable access and choice by providing data, analytics, and connections that bring together investors and providers. The organization delivers the most trusted, objective, and timely insights and implications derived from its analytics, which benefit from NIC’s affiliation with NIC MAP Vision, the leading provider of comprehensive market data for senior housing and skilled nursing properties. NIC events, which include the industry’s premiere conferences, provide sector stakeholders with opportunities to convene, network, and drive thought-leadership through high-quality educational programming. To see all that NIC offers, visit nic.org.
NIC MAP Vision gives operators, lenders, investors, developers, and owners unparalleled market data for the seniors housing and care sector.