
Length of Stay and the Importance of Measuring Net Worth in Senior Housing Market Selection
June 22, 2021
NIC’s recent acquisition of VisionLTC and the creation of NIC MAP Vision integrates the market-leading NIC MAP® Data Service with VisionLTC’s best-in-class data for investors, owners, and operators to provide significantly deeper and broader data for industry stakeholders. This article highlights one of the data concepts available to clients.
Key Takeaway: Typically, in seniors housing market feasibility studies, the target demographic is qualified by households or individuals that can afford to pay the minimum or average annual rent charged by a property. Depending upon the property type under consideration, a simple annual income qualification search metric alone may not always be sufficient—and may return different results.
Some Context: Whether a development or acquisition strategy is proactively market-driven by identifying specific markets that meet pre-determined criteria, or reactive by reviewing a specific property’s characteristics (such as size, unit count, asking rents and programmatic features), data on demographic, psychographic, and wealth characteristics of potential new residents is critical. Gathering data on household net worth (“wealth”) can be particularly challenging but is an essential data point in quantifying a target market with accuracy. An analysis of average annual household income in both a primary market area (PMA) and its respective metropolitan area provides insights into the scale of available purchasing power—but understanding household net worth is also crucial to accurately assessing the marketability of seniors housing to prospective residents—especially when average length of stay by property type is considered.
Financial Resources and Length of Stay (LOS)
Typically, in seniors housing market feasibility studies, target market depth is quantified by whether qualified households or individuals can afford to pay the minimum or average annual rent charged by a property. The metrics commonly used are thresholds for income-qualified age cohorts for either households or individuals. Home value is also often considered because the sale of a home may be used to subsidize the cost of residency. However, there is often a considerable difference between a property’s minimum or average rent (annualized) and the average annual income of age-qualified households when including a consideration of the estimated length of stay to determine how long a typical resident’s financial resources will allow them to live at the community.
The income streams of seniors include earnings, pensions and annuities, Veteran’s payments, alimony, Social Security, retirement savings, assets such as vehicles and other investments such as stocks, IRAs and bonds. These income streams alone do not make up all of a household’s financial resources, however. Housing equity net of mortgage debt is an important source of capital often used to support a move to seniors housing. Combined, these financial resources make up net worth. Unfortunately, obtaining net worth data is challenging at best, especially information on the housing equity component. The U.S Census Bureau’s decennial census and its yearly American Community Survey (ACS) do not measure net worth. And, while the U.S. Census Bureau’s Survey of Income and Program Participation tracks a wide variety of wealth-related data points, it does so only at the national level.
According to the State of Seniors Housing 2020 report, seniors housing median length of stay rates vary widely from 4.8 years (58.0 months) for CCRC residents to 1.4 years (17.1 months) for memory care residents. Therefore, net worth data, which considers all of a potential resident’s financial assets, may be a better source in selecting markets in terms of ability to pay a property’s fees for an estimated duration of residency than average annual income based on one year of minimum or average rents alone.
Seniors often combine income and assets (including the proceeds of home sales) to fund residency in seniors housing—and this is especially true for Continuing Care Retirement Communities (CCRCs, also referred to as life plan communities) which typically attract younger, healthier residents who plan to age in place (across the continuum of care from independent living to nursing care) for a longer period of time than residents that enter senior living with higher levels of care needs. In fact, the relatively newly designated term “life plan communities” is based on the concept that most residents in CCRCs are planners and have adequate savings to take them through retirement.
The primary payment source for CCRCs is the resident’s income and assets. Additionally, the value and liquidity of prospective residents’ houses are particularly important factors in their ability to afford an entrance-fee CCRC.
Different Measures, Different Outcomes: CCRCs Example
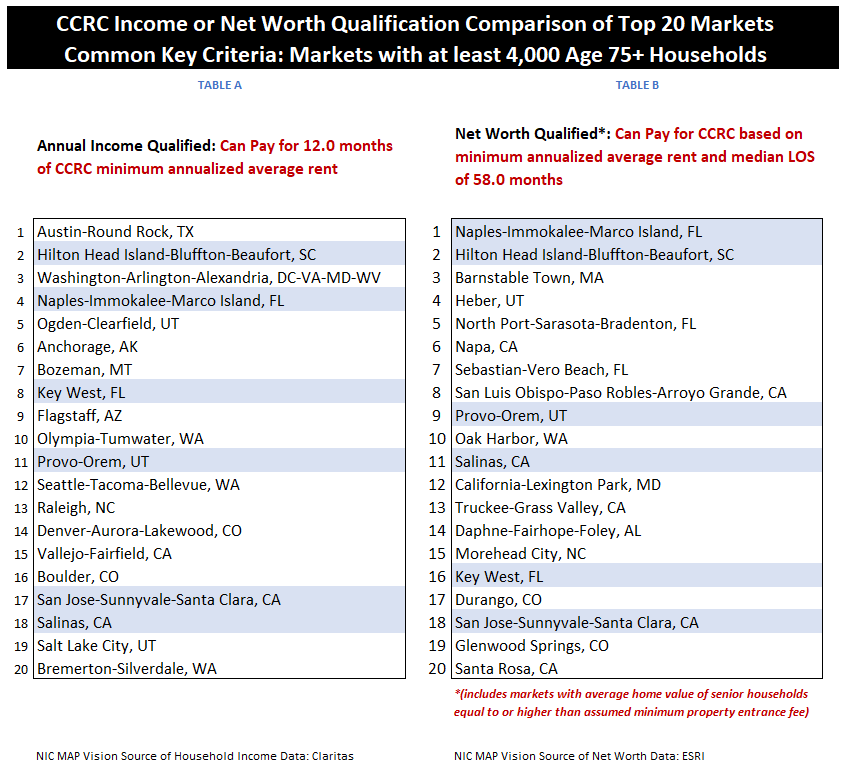
To illustrate different outcomes in broad market selection based on minimum annual income or net worth, the comprehensive datasets provided by NIC MAP and Vision LTC, powered by NIC MAP Vision, in combination with a unique subset of its 4,000-plus data points related to senior housing demand was used to develop a select subset of the top 929 MSAs across the country (Metropolitan Statistical Areas) based on relative target market depth (excluding supply), quantified in two different ways (Tables A & B).
Pre-Determined Target Market Selection Criteria:
-
Age: Households age 75+
-
Markets: 4,000 or more Age-Qualified households
-
Length of Stay: Data sourced from The State of Seniors Housing, 2020
-
Median, all CCRCs excluding nursing care beds, 58.0 months
-
-
Annual Income (Table A): Minimum, based on annualized average monthly rent at CCRCs in 1Q 2021
-
Net Worth (Table B): Minimum, based on CCRC average entrance fee, average length of Stay (LOS), and annualized average monthly rent as of 1Q 2021
-
Includes markets with average home value of senior households equal to or higher than assumed minimum property entrance fee
-
As shown below, selecting markets for further analysis by ranking the top 20 markets by either the percentage of age-and income-qualified households (Table A) or by the percentage of net worth-qualified households (Table B) yields generally different outcomes (and some similarities highlighted in blue).
Although six markets were common in both scenarios, looking at the top 20 net worth-qualified markets expands the income-based selection to markets that can be reasonably expected to be able to support the typical resident’s entire stay in a CCRC.
Given the diversity of seniors housing property types and levels of care setting combinations, and wide range of specific turnover rates, any market selection exercise or market feasibility study can be made more accurate with net worth data than relying on annual income data alone.
Having access to a variety of data related to seniors housing markets puts you in the best position to make informed decisions. NIC MAP Vision’s deep database of data points allows the analyst to search for any target market with unparalleled specificity—and creativity—and investment decisions with enhanced accuracy.
Interested in learning more about the data used in this analysis?
To learn more about NIC MAP and VisionLTC data, powered by NIC MAP Vision, and about accessing the data featured in this article, schedule a meeting with a product expert today.
About Lana Peck
Lana Peck, a senior principal at the National Investment Center for Seniors Housing & Care (NIC), is a seniors housing market intelligence research professional with expertise in voice of customer analytics, product pricing and development, market segmentation, and market feasibility studies including demand analyses of greenfield developments, expansions, repositionings, and acquisition projects across the nation. Prior to joining NIC, Lana worked as director of research responsible for designing and executing seniors housing research for both for-profit and nonprofit communities, systems and national senior living trade organizations. Lana’s prior experience also includes more than a decade as senior market research analyst with one of the largest senior living owner-operators in the country. She holds a Master of Science, Business Management, a Master of Family and Consumer Sciences, Gerontology, and a professional certificate in Real Estate Finance and Development from Massachusetts Institute of Technology (MIT).
—-
This blog was originally published on NIC Notes.
About NIC
The National Investment Center for Seniors Housing & Care (NIC), a 501(c)(3) organization, works to enable access and choice by providing data, analytics, and connections that bring together investors and providers. The organization delivers the most trusted, objective, and timely insights and implications derived from its analytics, which benefit from NIC’s affiliation with NIC MAP Vision, the leading provider of comprehensive market data for senior housing and skilled nursing properties. NIC events, which include the industry’s premiere conferences, provide sector stakeholders with opportunities to convene, network, and drive thought-leadership through high-quality educational programming. To see all that NIC offers, visit nic.org.
NIC MAP Vision gives operators, lenders, investors, developers, and owners unparalleled market data for the seniors housing and care sector.