
NIC MAP Data Release Webinar 2Q22 Key Takeaways: Senior Housing Occupancy Continued to Recover
August 4, 2022
NIC MAP Vision clients, with access to NIC MAP® data, attended a webinar in mid-July on key seniors housing data trends during the second quarter of 2022. Findings were presented by the NIC Analytics research team. Here are key takeaways from the data release.
2Q 2022 Key Themes
Key trends during the second quarter of 2022 for the seniors housing market include:
- Senior housing occupancy increased 0.9 percentage point to 81.4%.
- The number of senior housing units under construction across the 31 NIC MAP Primary Markets was the fewest since 2015.
- Assisted living’s occupancy is recovering faster than that of independent living, but both property types still require significant occupancy gains to fully recover to their respective pre-pandemic levels.
- Reflective of its faster recovery, the average asking rent for assisted living grew by 4.6% from year-earlier levels. This represents its largest annual increase since NIC MAP began reporting the data in 2005.
- The preliminary data shows the dollar volume of seniors housing and care property sales transactions during the second quarter totaled $2.0 billion.
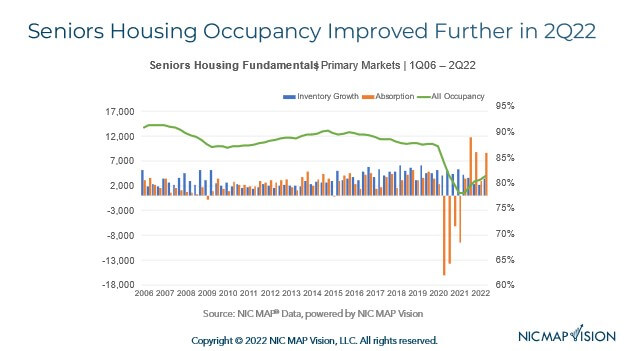
Takeaway #1: Senior Housing Occupancy Improved Further in 2Q 2022
- The occupancy rate for seniors housing—where seniors housing is defined as the combination of the majority independent living and assisted living property types—rose 0.9 percentage point during the second quarter of 2022 to 81.4% for the 31 NIC MAP Primary Markets. This marked the fifth consecutive quarter where occupancy did not decline. At 81.4% in the second quarter, occupancy was 3.4 percentage point above its pandemic-related low of 78.0% recorded in the second quarter of 2021 but was still 5.8 percentage points below its pre-pandemic level of 87.2% in the first quarter of 2020.
- Demand as measured by the change in occupied inventory or net absorption was strong in the second quarter, increasing by more than 8,609 units in the Primary Markets. This was the strongest demand ever recorded by NIC MAP except for the post-pandemic boost in demand we saw during the last half of 2021.
- Since the recovery began in second quarter 2021, 35,544 units of the 45,525 units placed back on the market have been re-occupied, or 78% of those units.
- These improved supply and demand dynamics at midyear offer a positive outlook for 2022.
Takeaway #2: Units Under Construction Fewest Since 2015
- In the second quarter of 2022, the number of seniors housing units under construction in the 31 NIC MAP Primary Markets was the least since 2015.
- For assisted living, there were 19,162 units under construction, down about 1,000 units from the first quarter. Notably, this was the fewest units under construction since early 2015. As a share of inventory, this amounted to 5.7% but below its peak of 10.1% in late 2017.
- For independent living, there were 15,882 units under construction in the second quarter, equal to 4.5% of the stock of independent living, as compared to 6.7% in 1Q 2020.
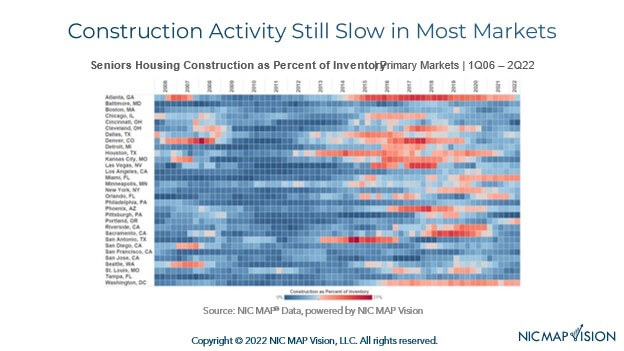
Takeaway #3: Construction Activity Still Slow in Most Markets
- This heat map shows which metropolitan markets are experiencing the most construction activity. First, notice the generally blue tones on the right side of the chart indicating that construction activity is relatively “cool” in many markets.
- Looking at the right-hand part of the grid, those markets that are shaded brighter red are seeing the most construction as a share of inventory. This includes Miami where construction as a share of inventory amounted to 11.2% in the second quarter (2,885 units in 18 properties). This was the market’s second most ever (first was 2Q 2021 at 11.3%). And, at 9.8% of inventory, Portland, Oregon’s construction was at an all-time high at 2,093 units in 15 properties. Washington, D.C. (10%) was also high as seen by the red shadings.
- Atlanta stands out on this heat map, with its red shades, but construction as a share of inventory in Atlanta was relatively low for Atlanta in the second quarter at 7.3% (16 building and 1,876 units). This is well below the 17.4% share seen in Atlanta in mid-2017, when there were 31 buildings under construction (over 3,333 units). Since that time, the inventory of senior housing in Atlanta has increased by 33% (more than 6,300 units).
- On the other extreme is Pittsburgh where construction as a share of inventory was virtually zero in 2Q 2022. This is a dramatic shift from a share of 10% in 2019.
- For perspective, for senior housing, the 2Q 2022 construction level equals 5.1% of inventory for the Primary Markets, and it peaked at 7.7% in late 2017 and more recently at 7.7% in the pre-pandemic 1Q 2020.
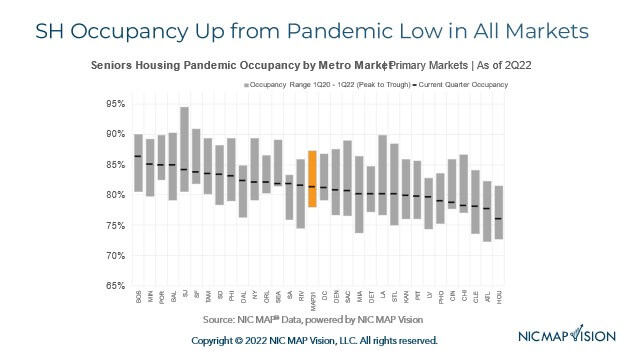
Takeaway #4: Senior Housing Occupancy Up from Pandemic Low in All Markets
- The chart below provides more detail on market recovery patterns from the pandemic low by metropolitan market. The dash line shows the occupancy rate in 2Q 2022, and the top of the grey bar shows the 1Q 2020 occupancy rate and the bottom of the grey bar shows the pandemic-related low point which was 1Q 2021 for many markets, but some did not reach that point until later in 2021.
- Of note on the chart, all markets are above their pandemic-related low points. The market with the highest first quarter senior housing occupancy rate was Boston at 86.3%, followed by Minneapolis (85.1%), Portland, and Baltimore. San Jose fell from its second-rate position in the first quarter and its first-place position prior to that. The lowest were Houston (76.1%), Atlanta, and Cleveland.
- There is a 10.2 percentage point wide gap between the best and worst performing markets.
- Based on the length of the grey bar in the chart, you can see that San Jose, St. Louis, Los Angeles, Miami, and Sacramento saw the deepest drops in occupancy, all more than 12 percentage points. In contrast, Orlando, Portland, San Antonio, Detroit, Seattle, and D.C. all saw peak-to-trough losses of less than 8 percentage points.
- Regarding improvements from their respective low points, Riverside saw a jump of 7.1 percentage points from its low point to 81.6%, but its low point was very low at 74.5%. Miami saw a gain of 6.4 percentage points, an improvement from a low of 73.8% up to 80.2%. The smallest improvements occurred in Cincinnati, Seattle, and Chicago.
- For perspective, the aggregate Primary Markets’ occupancy rate was 81.4%, and it saw a 3.4 percentage point improvement from its low point.
Key Takeaway #5: Preliminary Closed Seniors Housing & Care Dollar Volume: $2.0 Billion for 2Q 2022
- According to the preliminary data, the number of closed deals and the dollar volume closed in the second quarter increased from the first quarter. The second quarter ended with $2.0 billion in closed transaction volume. If that figure were to hold, volume would be up 22% from the relatively weak first quarter as volume closed registered only $1.7 billion in 1Q2022.
- The number of transactions closed, a different measure in activity than dollar amount, increased from 68 deals closed in the first quarter to 80 deals in the second quarter, according to the preliminary figures.
- Of the $2.0 billion closed, the private buyers represented $1.5 million of that, or in other words, represented 73% of the closed volume in the second quarter. The private buyer category is comprised of companies that are not publicly traded—for example, a private REIT, single owner or partnership, family offices, etc. Private partnerships and family regional owner/operators have been a steady source of liquidity. However, we are now coming into a different paradigm in terms of the real estate investment markets as interest rates and inflation continue to pressure overall liquidity.
- Note that the transactions data discussed in this key takeaway include only the closed property sales transactions throughout the United States. It does not include deals that have been announced in the quarter and not yet closed. It is also important to remember that this data is preliminary for the second quarter of 2022, as data points could be updated with other deals being captured as we learn about their closings. These updates typically occur as public records become available and given slower recordings within public records it is possible this data is updated more so than usual, especially when it comes to single property transactions that are often under the radar from public announcement and reporting.
Interested in learning more?
To learn more about NIC MAP data, powered by NIC MAP Vision, an affiliate of NIC, and accessing the data featured in this article, schedule a meeting with a product expert today.
—-
This blog was originally published on NIC Notes.
About NIC
The National Investment Center for Seniors Housing & Care (NIC), a 501(c)(3) organization, works to enable access and choice by providing data, analytics, and connections that bring together investors and providers. The organization delivers the most trusted, objective, and timely insights and implications derived from its analytics, which benefit from NIC’s affiliation with NIC MAP Vision, the leading provider of comprehensive market data for senior housing and skilled nursing properties. NIC events, which include the industry’s premiere conferences, provide sector stakeholders with opportunities to convene, network, and drive thought-leadership through high-quality educational programming. To see all that NIC offers, visit nic.org.
NIC MAP Vision gives operators, lenders, investors, developers, and owners unparalleled market data for the seniors housing and care sector.