
NIC Skilled Nursing Data Report: Key Takeaways from the Fourth Quarter 2019
April 2, 2020
NIC released its fourth quarter 2019 Skilled Nursing Data Report, which includes key monthly data points from January 2012 through December 2019.
Here are some key takeaways from the report:
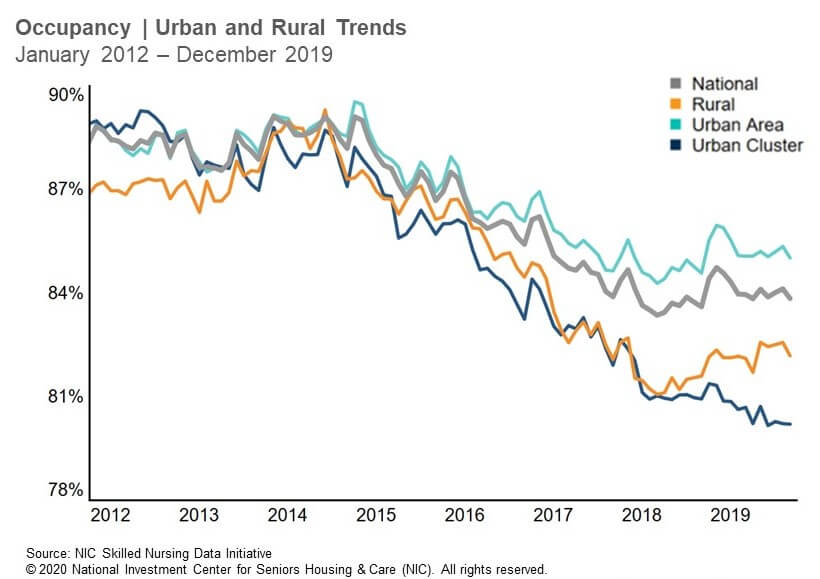
1. The occupancy rate for skilled nursing continued to stabilize as the year closed out in 2019. Occupancy was essentially flat from the third to the fourth quarter, decreasing by only 4 basis points and ending the fourth quarter at 83.8%. This was an increase of 24 basis points from December 2018, when occupancy was 83.6%. Notably, the occupancy rate is up 48 basis points from the time-series low set in June 2018. The fourth quarter occupancy trend varied by geographic area, with urban areas experiencing a slight decrease of 3 basis points, while rural areas decreased 26 basis points and urban cluster areas increased 4 basis points from the third to fourth quarters of 2019. The occupancy rate ended 2019 at 82.2% in rural areas and 85.0% in urban areas, representing a difference of 283 basis points. That difference was larger one year ago in the fourth quarter 2018, when it was 297 basis points.
2. Skilled mix increased 41 basis points to 25.0% in the fourth quarter of 2019 from the prior quarter. This increase from the third to the fourth quarter is not unexpected as historical data has shown skilled mix to hold relatively steady this time of year, even though there has been continued pressure on skilled mix since 2015. Skilled mix declined, albeit slightly, from December 2018 (25.1%), but the fact that there was only a decrease of 5 basis points is somewhat of a positive given the prior yearly comparison showed a decline of 48 basis points. The 40-basis point increase to 6.6% in managed Medicare patient day mix from the prior year suggests managed Medicare is preventing a larger year-over-year decline in skilled mix, since Medicare patient day mix continued its overall downward trend by decreasing 82 basis points from the prior year to 11.3%. The skilled mix trend varied by geography as it decreased in rural areas from the prior quarter and the prior year. Urban areas, however, were flat from the prior year but up compared to the third quarter of 2019.
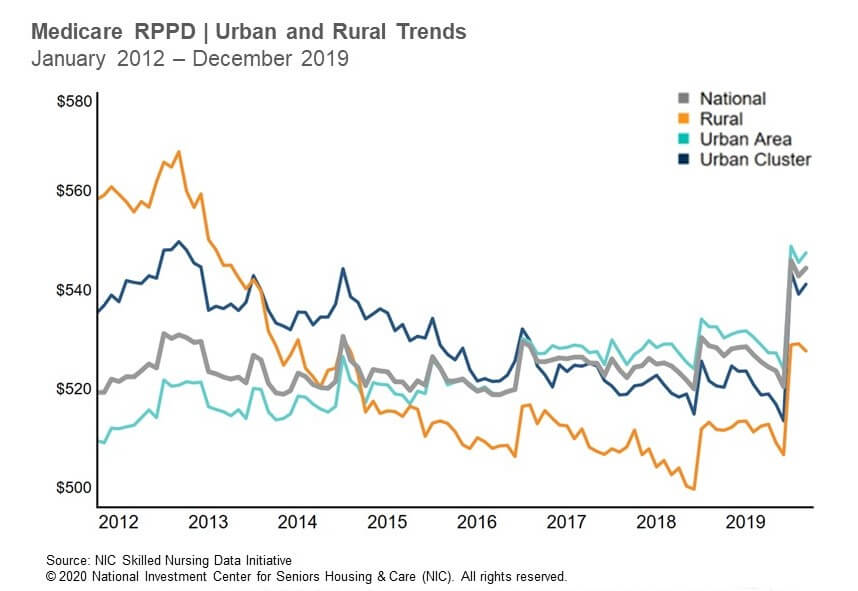
3. Medicare revenue per patient day (RPPD) increased in the fourth quarter of 2019 by 4.6%, ending the year at $544. This was expected for many operators given the new Patient Driven Payment Model (PDPM) that began October 1, 2019 because the new payment reimbursement model is structured for the total care of patients, therefore potential for more reimbursement, instead of a therapy-driven payment model. It is important to keep in mind that this increase was seen in the first quarter that PDPM became effective and it remains to be seen if this is a one-time adjustment or the beginning of a trend. We will have to wait to see how the operating expense part of the equation evolves before making general conclusions. Medicare RPPD also increased from the prior year, with the 3% increase mostly driven by the fourth quarter 2019 new payment model. The increase was consistent across geographies, as both rural and urban areas saw quarterly and yearly increases in RPPD. Meanwhile, managed Medicare RPPD showed some stabilization from the third to the fourth quarter of 2019 and increased 0.9% to end the year at $441.
4. Medicare revenue mix increased 74 basis points from the third quarter of 2019 to end the year at 21.5%. It also increased from the prior year, suggesting the increase in Medicare RPPD from PDPM played a role as Medicare patient day mix decreased from the prior year. However, Medicare revenue mix is down 504 basis points from January 2012, with competition from other care settings, growth in managed care, and length of stay pressure challenging the Medicare fee-for-service business. Meanwhile, Medicaid ended 2019 with over 50% of revenue mix as managed Medicare revenue mix decreased 95 basis points to end the year at 9.9%
To get more trends from the latest data you can download the NIC Skilled Nursing Data Report here. There is no charge for this report.
The report provides aggregate data at the national level from a sampling of skilled nursing operators with multiple properties in the United States. NIC continues to grow its database of participating operators in order to provide data at localized levels in the future. Operators who are interested in participating can complete a participation form at nic.org/skillednursing. NIC maintains strict confidentiality of all data it receives.
About Bill Kauffman
Senior Principal Bill Kauffman works with the research team in providing research and analysis in various areas including sales transactions and skilled nursing. He has lead roles in creating new and enhanced products and implementation of new processes. Prior to joining NIC he worked at Shelter Development in investing/acquiring, financing, and asset management for over $1 billion in assets. He also had key roles in the value creation and strategic planning and analysis for over 65 entities. He received his Bachelor of Business Administration in Finance from the College of Business and Economics at Radford University and his Master of Science in Finance from Loyola College in Maryland. He also holds the Chartered Financial Analyst Designation (CFA).
NIC MAP Vision gives operators, lenders, investors, developers, and owners unparalleled market data for the seniors housing and care sector.