
Senior Housing Occupancy Rate Over Halfway Back to Pre-Pandemic Level
November 15, 2022
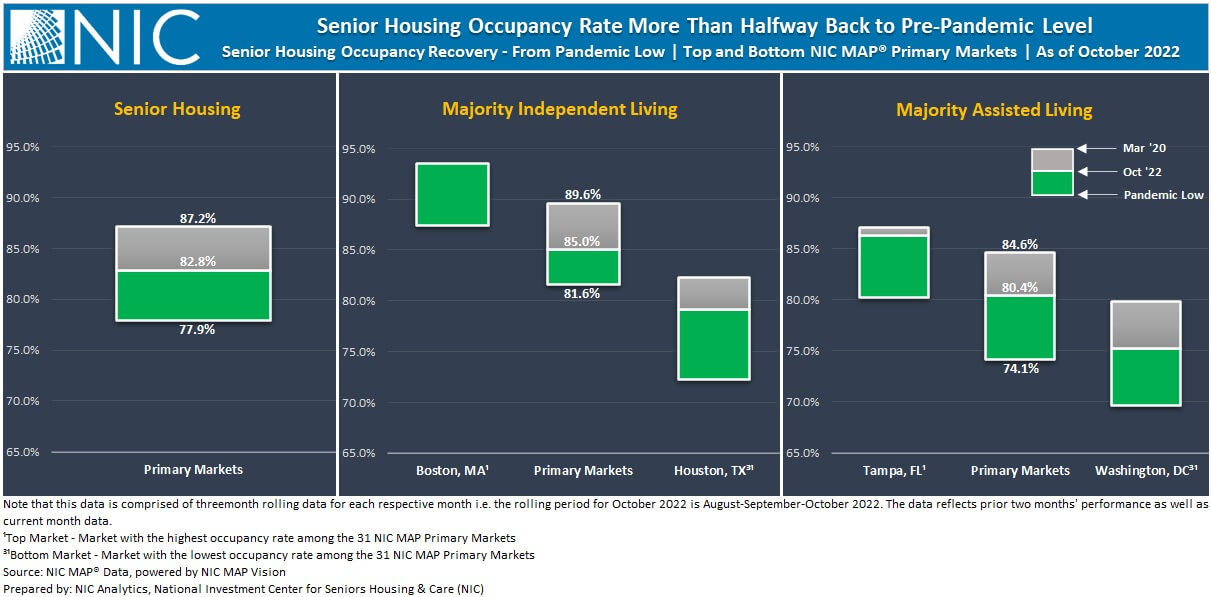
The all-occupancy rate for senior housing for the NIC MAP Primary Markets increased to 82.8% in the October 2022 reporting period, up 0.6 percentage point (pps) from the September 2022 reporting period on three-month rolling basis, according to intra-quarterly NIC MAP® data, released by NIC MAP Vision. From its pandemic record low of 77.9% in June 2021, senior housing all-occupancy increased by 4.9pps and is now more than halfway in the road to recovery, with a gap of 4.4pps from the pre-pandemic March 2020 level of 87.2%.
At 85.0%, the all-occupancy rate for majority independent living (IL) properties for the NIC MAP Primary Markets increased 0.3pps from September 2022 but remained 4.6pps below March 2020 levels. For majority assisted living properties (AL), the all-occupancy rate for the NIC MAP Primary Markets was up 0.7pps to 80.4% from September 2022 but still 4.2pps below March 2020 levels. Occupancy for AL continued to recover relatively fast compared with IL despite the relatively large inventory growth since the onset of the pandemic, but it’s notable that AL also fell further from peak to trough. From its pandemic-related low, all-occupancy for AL increased by 6.3pps, nearly 3pps more than IL (up 3.4pps since March 2021).
The pace of year-over-year inventory growth for both IL and AL continued to be relatively slow compared with pre-pandemic levels. The inventory of majority independent living properties for the NIC MAP Primary Markets increased by 1.1% or 3,887 units from year-earlier levels in the October 2022 reporting period. This was the smallest annual growth since 2015. Assisted living inventory increased by 2.0% over this same period.
All-occupancy rates increased or remained stable in 24 of the 31 Primary Markets for IL in the October 2022 reporting period compared with September 2022. At 93.5%, Boston’s occupancy increased by 0.7pps from September 2022 and ranked the highest among the 31 NIC MAP Primary Markets. Boston recovered the 6.1pps lost during the height of the pandemic and is the third independent living primary market, on average, to return/exceed pre-pandemic March 2020 levels along with San Antonio and Las Vegas. Houston IL occupancy improved by 2pps from September 2022, the largest gain among the 31 NIC MAP Primary Markets, but at 79.1%, it is still ranked at the bottom of the pack. In fact, Houston is the only IL primary market with an average occupancy rate below 80%.
All-occupancy rates rose or remained stable in 30 of the 31 Primary Markets for assisted living in October 2022 compared with September 2022. Tampa had the highest occupancy rate for AL among the 31 Primary Markets at 86.3% (up 0.9pps from October 2022 and is now 0.8pps below March 2020 levels). The Washington, D,C, occupancy rate at 75.2% in October 2022, is up 0.1pps from September 2022. Washington had the lowest occupancy rate for AL among the 31 Primary Markets.
Interestingly, the metropolitan markets at the bottom of the pack in occupancy rankings, e.g., Houston – IL and Washington, DC – AL had a relatively large year-over-year inventory growth compared with markets ranked first among the 31 NIC MAP Primary Markets, e.g., Boston – IL and Tampa – AL. To learn more about the inventory growth from year-earlier levels across these select NIC MAP metropolitan markets, download the NIC Intra-Quarterly Snapshot.
Keep track of the most timely and comprehensive review of the sector’s market fundamentals and trends. The NIC Intra-Quarterly Snapshot monthly publication, available for complimentary download on our website, continues to provide a powerful and closely watched means to stay ahead of industry trends, even as senior housing markets sustain a fast pace of evolution and adaptation, amidst an apparent recovery.
The November 2022 Intra-Quarterly Snapshot report will be released on nic.org on Thursday, December 10, 2022, at 5:00pm.
Interested in learning more about NIC MAP Intra-Quarterly data? To learn more about NIC MAP Vision data, schedule a meeting with a product expert today.
NIC MAP Vision gives operators, lenders, investors, developers, and owners unparalleled market data for the seniors housing and care sector.