
Assisted Living Demand Bouncing Back Relatively Swiftly
March 17, 2022
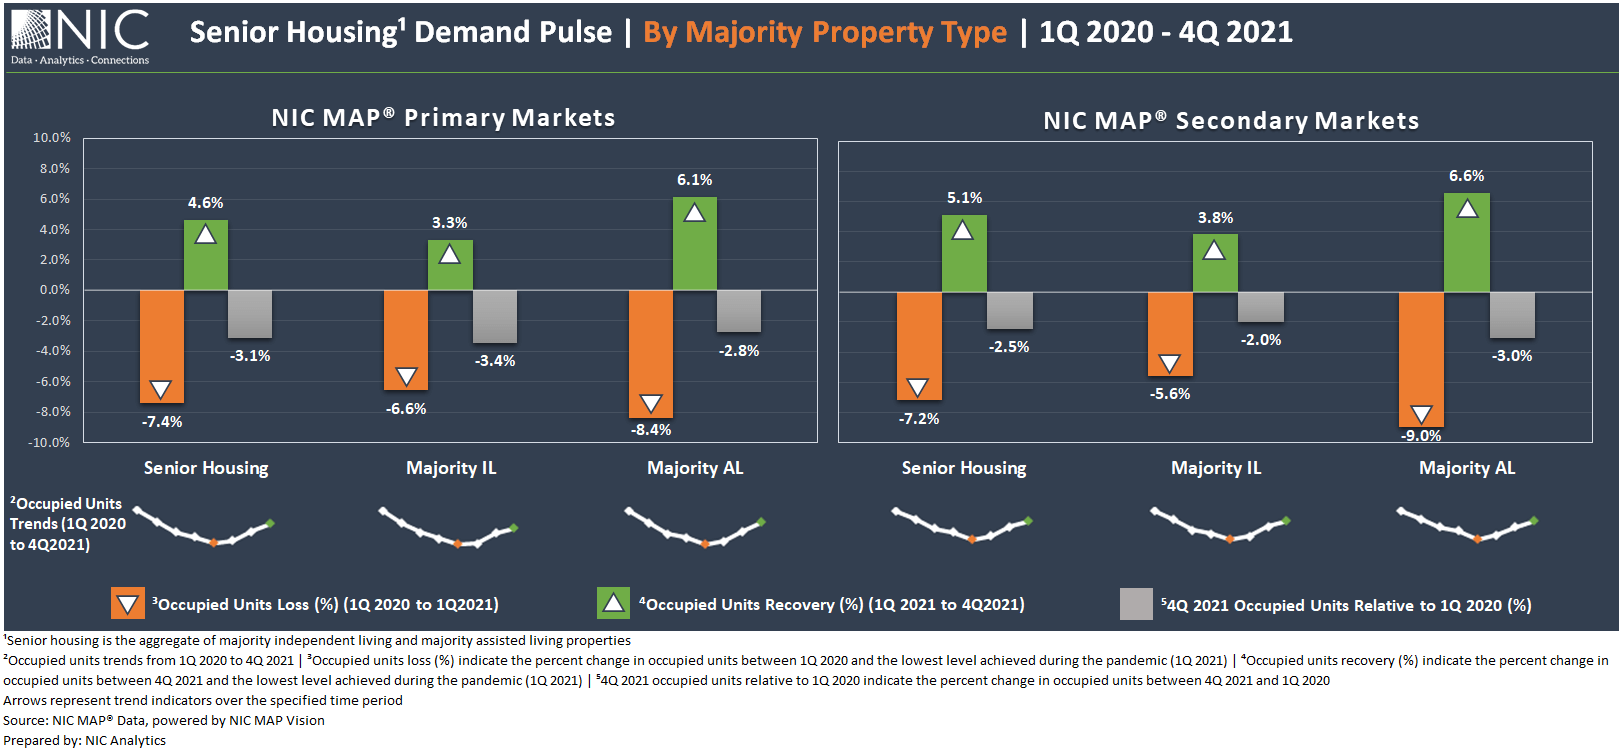
The pandemic disruption in all its forms continues to test and challenge the senior housing sector. But the level of agility, preparedness and responsiveness among senior housing operators has never been higher and remains a tailwind for senior housing demand, as measured by the change in occupied stock. In this analysis, we examine the drop and subsequent recovery in the level of occupied units by majority property type since the pandemic began to influence the senior housing sector, over the period from 1Q 2020 to 4Q 2021, and across the 31 NIC MAP Primary Markets and the 68 NIC MAP Secondary Markets Aggregates.
Note that this analysis looks at demand only and does not take into account inventory growth and properties under development.
Senior Housing Demand Contraction. The first quarter of 2021 marked the lowest level of occupied units since 2017. In the early months of the pandemic (1Q 2020 to 1Q 2021), about 42,100 units were placed back in the market on a net basis or “vacated” on a net basis for the 31 NIC MAP Primary Markets aggregate while 22,100 units were vacated for the 68 NIC MAP Secondary Markets, equivalent to a 7.4% and 7.2% decrease in occupied stock, respectively. At its low point, senior housing occupied units for both market aggregate concepts stood at their 1Q 2017 level.
Drilling down by Majority Property Type. The impact of the pandemic weighed heavily on majority assisted living (AL) properties across both the NIC MAP 31 Primary Markets and the 68 NIC MAP Secondary Markets aggregates with 8.4% and 9.0% declines in occupied units between 1Q 2020 and 1Q 2021, respectively. Demand contraction across majority independent living properties (IL) was relatively smaller at 6.6% for the NIC MAP Primary Markets (1.8 percentage points less than AL) and 5.6% for the NIC MAP Secondary Markets (3.4 percentage points less than AL).
The disparity in the degree of demand contraction during the first year of the pandemic may to be linked to the level of care and the relatively higher acuity levels and often greater frailty seen among residents in majority assisted living properties (defined as properties where assisted living units and/or memory care units comprised the largest share of inventory) than in majority independent living properties. In fact, findings from the 2020 study from NIC and NORC at the University of Chicago showed that the average mortality rate was the least in independent living and comparable to its corresponding county’s mortality rate, while average mortality rate for assisted living was slightly higher but notably not as high as for memory care or nursing care.
Senior Housing Demand Recovery. Due to unprecedented demand momentum in the last three quarters of 2021 (2Q 2021, 3Q 2021, 4Q 2021), senior housing occupied units grew by 4.6% for the 31 NIC MAP Primary Markets, equivalent to over 24,400 units absorbed on a net basis. Over the same period, occupied units within the 68 NIC MAP Secondary Markets increased by 5.1%, equivalent to 14,500 units absorbed on a net basis and 0.5 percentage points higher than the NIC MAP Primary Markets.
Although senior housing demand for both market aggregates have had three consecutive quarters of real momentum and consistency, the 4Q 2021 occupied stock for the 31 NIC MAP Primary Markets was still 3.1% below pre-pandemic 1Q 2020 levels, equivalent to 17,700 units vs. negative 2.5% for the 68 NIC MAP Secondary Markets, equivalent to over 7,500 units.
Drilling down by Majority Property Type. Like the sector’s demand contraction, its demand recovery has proven to also be uneven across different types of properties. While the demand contraction was relatively larger for AL properties, the demand recovery across AL properties has similarly outpaced that of IL properties. Since 1Q 2021, occupied units for AL properties for the NIC MAP Primary Markets increased by 6.1%, nearly two-fold that of IL (3.3%). The same pattern holds true for the 68 NIC MAP Primary Markets with 6.6% for AL, 2.8 percentage points higher than IL properties (3.8%).
This uneven recovery across different types of properties could be linked to several factors. One plausible explanation could be tied to the move-ins. In majority assisted living properties, there are at least two different types of residents, (1) residents from independent living properties following the continuum of care, and (2) new residents from outside congregate settings. Move-ins in independent living properties generally come from one source–outside congregate settings.
It could also reflect a stronger “pent-up demand” for assisted living, since AL is considered a more need-based property type and services are often required. Independent living is frequently considered more choice-based and the urgency to move into an independent living property may not be as strong.
Notably, not all operators are experiencing the same trends, however. Based on anecdotes from conversations, some operators are finding very strong demand for independent living properties, and sometimes stronger than assisted living. Conversations suggest that the socialization aspects of independent living are drawing potential new residents as the isolation associated with the pandemic has simply been overwhelming and the idea of living with others in a congregate setting has become quite compelling.
This dive into recent trends is based solely on senior housing demand patterns. The concept of aggregate demand or the number of occupied units is important to evaluate senior housing markets’ recoveries. Further, the strong demand recovery patterns across markets and properties show that senior housing demand was not lost, but rather, for many residents, it was largely deferred due to the pandemic.
These demand statistics indicate once again that the recovery differs across markets and by property type. Additionally, individual property performance has been affected by COVID exposure, infection control protocols, acuity levels of residents, move-in and move-out velocity, operator access to capital, pressured operating margins due to low occupancy rates, and staffing challenges. Many of these factors have not gone away and will continue to exert influence over operator, property and metro area performance in 2022. However, as demand more fully recovers toward pre-pandemic levels, the market should begin to balance out.
Senior Housing Demand Pulse Metric– By Majority Property Type
Other related analyses: Senior Housing Demand – Deep Dive & Outlook – Senior Housing Demand – Deep Dive & Outlook
NIC MAP clients can access the full analysis on senior housing demand patterns by property type, region, individual markets, property age, profit status, operator chain size, and other NIC MAP data dimensions.
While this analysis looks at demand only and does not take into account inventory growth and properties under development, recent analysis featuring NIC MAP Intra-Quarterly Data shows that senior housing stabilized occupancy for the NIC MAP® Primary Markets held its ground in February 2022 despite the growth in inventory and the headwinds created by the Omicron surge and the consequential staffing crisis. This was also the case in September 2021 when occupancy withstood the Delta surge and was unchanged from August 2021.
Interested in learning more about NIC MAP Intra-Quarterly data? To learn more about NIC MAP data, powered by NIC MAP Vision, schedule a meeting with a product expert today.
—-
This blog was originally published on NIC Notes.
About NIC
The National Investment Center for Seniors Housing & Care (NIC), a 501(c)(3) organization, works to enable access and choice by providing data, analytics, and connections that bring together investors and providers. The organization delivers the most trusted, objective, and timely insights and implications derived from its analytics, which benefit from NIC’s affiliation with NIC MAP Vision, the leading provider of comprehensive market data for senior housing and skilled nursing properties. NIC events, which include the industry’s premiere conferences, provide sector stakeholders with opportunities to convene, network, and drive thought-leadership through high-quality educational programming. To see all that NIC offers, visit nic.org.
NIC MAP Vision gives operators, lenders, investors, developers, and owners unparalleled market data for the seniors housing and care sector.