
Senior Housing Occupancy Increased in First Quarter 2022 Despite Omicron — Key Takeaways from NIC MAP Senior Housing Data Release Webinar
April 29, 2022
NIC MAP Vision clients, with access to NIC MAP® data, attended a webinar in mid-April on key seniors housing data trends during the first quarter of 2022. Findings were presented by the NIC Analytics research team. Key takeaways included the following:
Takeaway #1: Senior Housing Occupancy Edged Up in 1Q 2022
- The occupancy rate for senior housing—where senior housing is defined as the combination of the majority independent living (IL) and assisted living (AL) property types—rose 0.2 percentage point from the fourth quarter of 2021 to the first quarter of 2022 for the 31 NIC MAP Primary Markets. This marked the third consecutive quarterly increase in occupancy. For perspective, this was a 2.5 percentage point increase from the pandemic-related low of 78.0% recorded in the second quarter of 2021 but was 6.7 percentage points below its pre-pandemic level of the first quarter of 2020.
- The 0.2 percentage point increase in occupancy in the first quarter is encouraging in light of the highly contagious omicron variant that was rampant during the early months of 2022. It is a testament to the success of the COVID-19 vaccines and to the infection control policies operators have put in place to keep residents safe.
- Continued, albeit moderating, demand and weak inventory growth associated with the slowdown in construction starts in 2020 contributed to the occupancy increase in recent months.
- More specifically, demand, as measured by the change in occupied inventory or net absorption, continued to recover in the first quarter of 2022, increasing by 2,761 units in the Primary Markets. This was below the rapid pace seen in the third and fourth quarters of 2021, however. Since the recovery began in second quarter of 2021, 26,683 of the 45,499 units placed back on the market have been re-occupied, or 59% of those units.
Takeaway #2: More Than Six Percentage Points Needed for Occupancy to Recover
- For senior housing, occupancy had fallen 9.2 percentage points from peak to trough and through the first quarter of 2022, occupancy has recovered by 2.5 percentage points. This means that another 6.7 percentage points of occupancy has to be recovered.
- The strongest recovery to date has been in assisted living. Overall, occupancy is up 3.7 percentage points from its low point, but it remains 6.8 percentage points below its Q1 2020 pre-pandemic level of 84.6%.
- IL occupancy was 1.4 percentage points above its low point, but remained 6.6 percentage points below its pre-pandemic peak, almost the same as for AL.
- And lastly, nursing home occupancy fell a very large 12.5 percentage points and has thus far recovered 3.6 percentage points of occupancy, almost the same as for AL, but it remains furthest behind its pre-pandemic occupancy at 77.6%, with a 9.0 percentage point gap. Note however, that the first quarter occupancy rate for NC is almost the same as for AL at 77.6% versus 77.9%, respectively.
- Within senior housing, AL occupancy remains below IL occupancy, but the pace of occupancy recovery has been more in the need-based AL majority property type. That said, anecdotally, we are hearing that the socialization aspect of IL is attracting new residents after the long-extended pandemic related period of isolation for so many older adults.
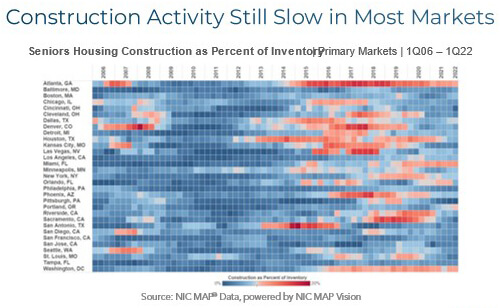
Takeaway #3: Construction Activity Still Slow in Most Markets
- This heat map shows which metropolitan markets are experiencing the most construction activity. Looking at the right-hand part of the grid, those markets that are shaded brighter red are seeing the most construction as a share of inventory. This includes Miami where construction as a share of inventory amounted to 10.7% in the first quarter (2,739 units in 17 properties). This was the second most ever (first was in 2Q 2021). And at 8.5% of inventory, Portland, Oregon’s construction was at an all-time high at 1,813 units in 12 properties.
- Atlanta stands out on this heat map, with its red shades, but construction as a share of inventory was relatively low for Atlanta at 9.4% (18 building and 2,371 units). This is well below the 17.4% share seen in Atlanta in mid-2017, when there were 30 buildings under construction (over 3,000 units). Since that time, the inventory of senior housing in Atlanta has increased by 33% (more than 6,000 units).
- The flip side is Sacramento where construction as a share of inventory shrank to 1.3% in 1Q 2022, down from 16.8% in 2019, with only three buildings underway with 160 units. Pittsburgh is also notable in that construction as a share of inventory was virtually zero in 1Q 2022. This was a dramatic shift from a share of 9.5% in 2019.
- For perspective, for senior housing, this equals 5.3% of inventory for the Primary Markets and it peaked at 7.8% in late 2017 and more recently at 7.5% pre-pandemic 1Q 2020.
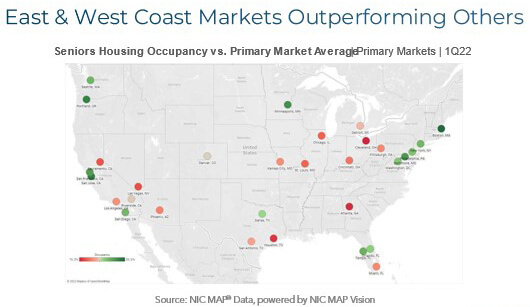
Takeaway #4: East and West Coast Markets Outperforming Other Markets
- The map below shows occupancy rates for the NIC MAP Primary Markets in the first quarter benchmarked to the Primary Market average of 80.6%. Markets with higher occupancy rates are colored deeper shades of green, while those poorer performing markets are colored deeper shades of red.
- It becomes clear that the strongest occupied markets are along the coast and the lesser occupied markets are generally in the center of the country.
Key Takeaway #5: Transaction Activity Dominated by Private Buyers in 1Q 2022
- Of the $1.2 billion of closed deals in the first quarter of 2022, private buyers represented $877 million, or 76% of the closed volume. For context, private buyers represented 43% of closed volume in 2021 for the entire year, with the public buyers coming next, representing 35% of closed volume in 2021.
- Private capital has been a steady source of capital for many years, especially the private partnerships and family regional owner/operators have been a steady source of liquidity. Private buyers have represented 35% or more of buyer activity in seniors housing and care every year since 2016.
- The private buyer is any company that is not publicly traded—for example, a private REIT or single owner or partnership, family offices, etc. The public type is just that: any publicly traded company. The institutional type is usually the equity funds that manage pension money or other types of institutional money. And cross-border represents any buyers from outside the United States.
- Note that the transactions data discussed in this key takeaway is only the closed property sales transactions throughout the United States. It does not include deals that have been announced in the quarter and not yet closed. It is also important to remember that this data is preliminary for the first quarter of 2022 as data points could be updated with other deals being captured as we learn about their closings. These updates typically occur as public records become available and given slower recordings within public records it is possible this data is updated more so than usual, especially when it comes to single property transactions that are under the radar from public announcement and reporting.
Interested in learning more?
- While the full key takeaways presentation is only available to NIC MAP clients with access to NIC MAP data, you can access the abridged version of the 1Q22 Data Release Webinar & Discussion featuring my exclusive commentary below. View the Abridged Slides Presentation
- To learn more about NIC MAP data, powered by NIC MAP Vision, an affiliate of NIC, and accessing the data featured in this article, schedule a meeting with a product expert today.
—-
This blog was originally published on NIC Notes.
About NIC
The National Investment Center for Seniors Housing & Care (NIC), a 501(c)(3) organization, works to enable access and choice by providing data, analytics, and connections that bring together investors and providers. The organization delivers the most trusted, objective, and timely insights and implications derived from its analytics, which benefit from NIC’s affiliation with NIC MAP Vision, the leading provider of comprehensive market data for senior housing and skilled nursing properties. NIC events, which include the industry’s premiere conferences, provide sector stakeholders with opportunities to convene, network, and drive thought-leadership through high-quality educational programming. To see all that NIC offers, visit nic.org.
NIC MAP Vision gives operators, lenders, investors, developers, and owners unparalleled market data for the seniors housing and care sector.