
1Q23 Key Takeaways: Seventh Consecutive Quarter of Senior Housing Occupancy Gains
May 22, 2023
NIC MAP Vision clients, with access to NIC MAP® data, attended a webinar in mid-April on key senior housing data trends during the first quarter of 2023. Findings were presented by NIC Analytics research team members. Key takeaways included the following:
Takeaway #1: Senior Housing Occupancy Rose 0.3 percentage points in 1Q 2023
The occupancy rate for senior housing—where senior housing is defined as the combination of the majority independent living and assisted living property types—rose 0.3 percentage points to 83.2% from the fourth quarter of 2022 to the first quarter of 2023 for the 31 NIC MAP Primary Markets. This marked the seventh consecutive quarter of occupancy increases.
At 83.2%, occupancy was 5.4 percentage points above its pandemic-related low of 77.8% recorded in the second quarter of 2021 and was 4.0 percentage points below its pre-pandemic level of 87.2% of the first quarter of 2020.
Demand as measured by the change in occupied inventory or net absorption moderated in the first quarter, increasing by 3,927 units in the Primary Markets after having increased by more than 8,000 units in the prior three quarters, but it was still well above the historical quarterly average of 2,251 units. The robust positive demand that has occurred over the past eight quarters has helped occupancy to improve.
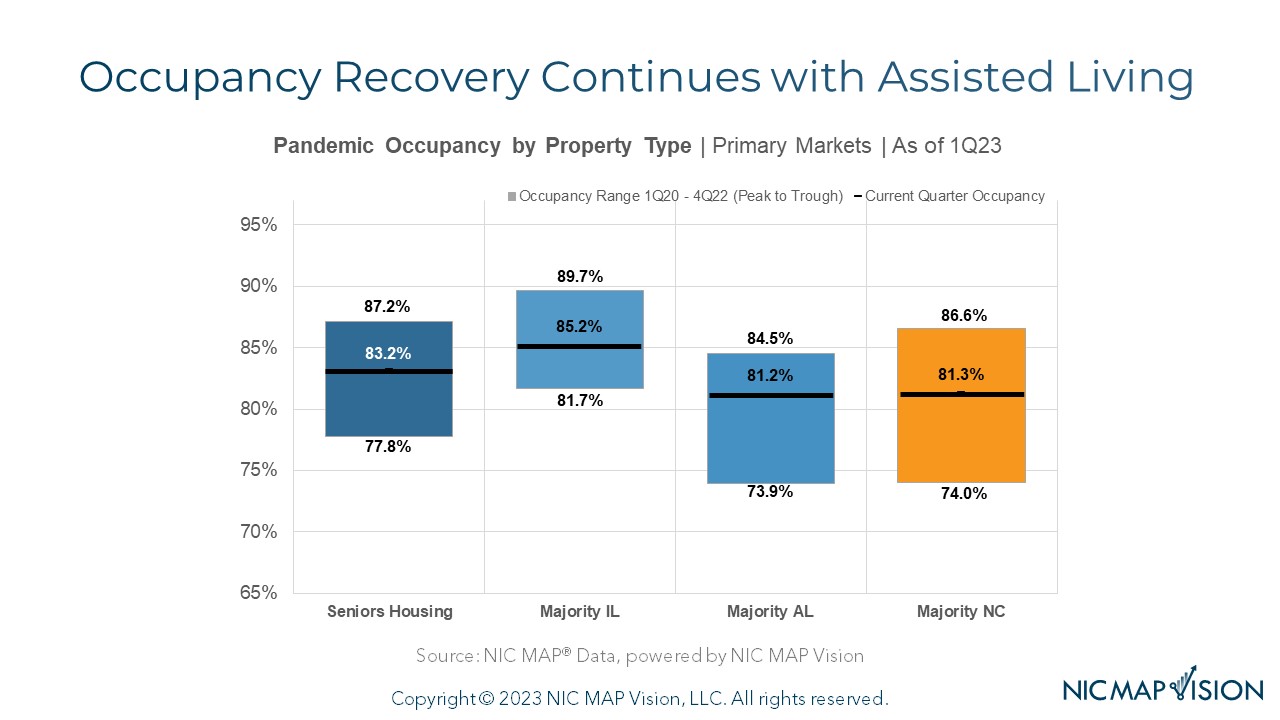
Takeaway #2: Occupancy Recovery Continues, Led by Assisted Living
The chart below shows the pace of recovery to date for each property type and the gap remaining to reach pre-pandemic 1Q 2020 occupancy levels.
Independent living occupancy was up 3.5 percentage points from its 2021 trough with 4.5 percentage points remaining to reach its pre-pandemic level.
Assisted living occupancy was up 7.3 percentage points from its 2021 trough with 3.3 percentage points remaining to reach its pre-pandemic level.
Nursing home occupancy was also up 7.3 percentage points from its 2021 trough with 5.3 percentage points remaining to reach its pre-pandemic level.
Takeaway #3: Annual Inventory Growth Rate Has Slowed Significantly for Assisted Living
Annual inventory growth in the first quarter for independent living stood at 1.7%, near its pre-pandemic average of 1.6%.
Assisted living inventory grew by a similar amount in the first quarter at 1.6%, but this growth was half the typical growth recorded for assisted living before the onset of the pandemic, which was 3.2% annually.
This slower inventory growth stems from the slowdown in construction starts that we experienced during the height of the pandemic, a trend that occurred for both independent living and assisted living.
Takeaway #4: Occupancy Rate Improvements in 1Q 2023 Were Largest for Single Properties, Small Chains, and Large Chains
The greatest occupancy rate improvements in the first quarter were for single properties (up 0.6%) and for small chains (up 0.6%) with 2 to 4 properties, followed by large chains (up 0.5%) with 10 to 24 properties.
Single properties continued to have the highest occupancy rate at 86.1% with only 3.1 percentage points of occupancy left to recover to reach its pre-pandemic level.
Meanwhile, medium chains of 5 to 9 properties and very large chains of 25 or more properties saw no change in their average occupancy rates from the fourth quarter of 2022 to the first quarter of 2023.
Despite the unchanged occupancy rate, the smallest gap to achieve pre-pandemic occupancy was for the medium chains with 3.0 percentage points remaining to recover.
The very large chains still had the weakest occupancy rate at 79.5%, with another 5.2 percentage points still to be recovered.
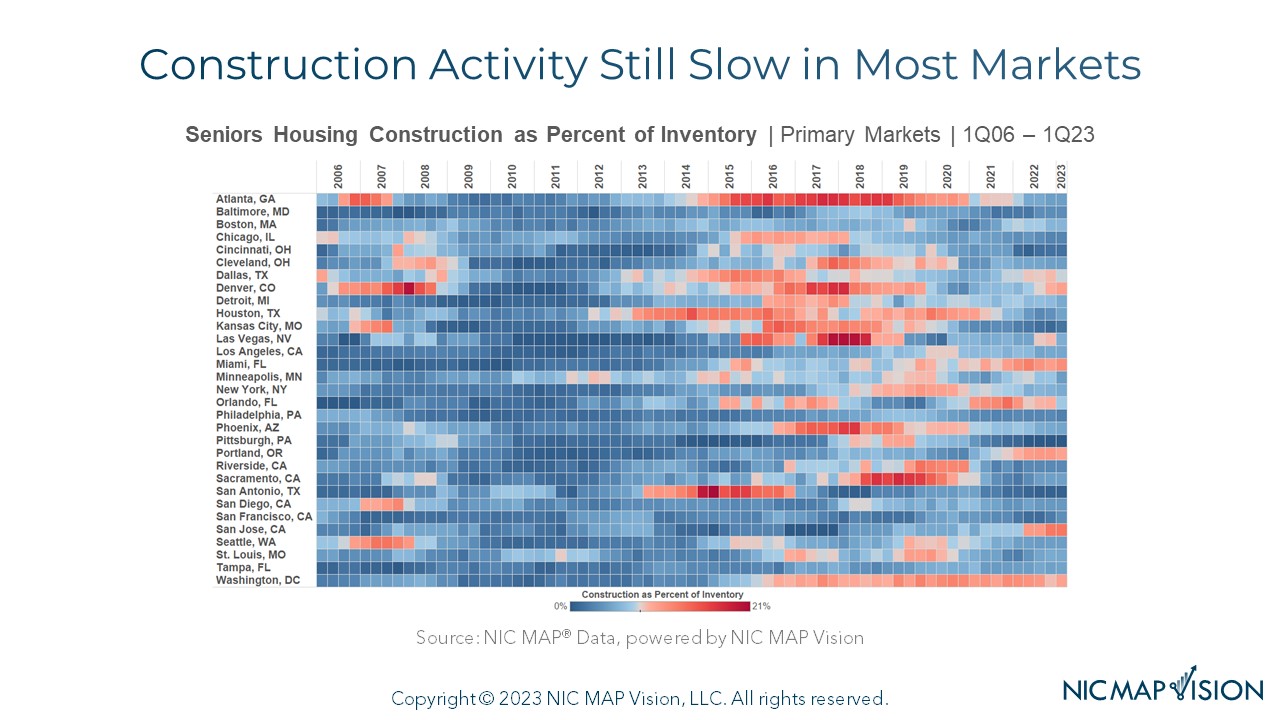
Takeaway #5: Construction Activity Still Slow in Most Markets
The heat map below shows which markets were experiencing the most construction activity over time.
For perspective, for senior housing overall, construction totaled 5.1% of inventory for the Primary Markets in the first quarter of 2023, down from a peak of 7.8% in 2019.
The blue tones indicate that construction activity is relatively “cool” in most markets during recent quarters.
The markets that are shaded brighter red had the most construction as a percent of inventory in the first quarter. This group was led by San Jose at 13%, followed by Miami at 11%, and Denver, Portland, and Washington, DC all at 10%.
At the other end of the spectrum were markets where there was very little construction underway in the first quarter; this includes Pittsburgh at 0%, San Antonio at 1%, and Cincinnati, and Kansas City at 2%.
Interested in learning more?
While the full key takeaways presentation is only available to NIC MAP clients with access to NIC MAP data, you can access the abridged version of the 3Q22 Data Release Webinar & Discussion featuring my exclusive commentary below.
View the Abridged Slides Presentation.
—-
This blog was originally published on NIC Notes.
About NIC
The National Investment Center for Seniors Housing & Care (NIC), a 501(c)(3) organization, works to enable access and choice by providing data, analytics, and connections that bring together investors and providers. The organization delivers the most trusted, objective, and timely insights and implications derived from its analytics, which benefit from NIC’s affiliation with NIC MAP Vision, the leading provider of comprehensive market data for senior housing and skilled nursing properties. NIC events, which include the industry’s premiere conferences, provide sector stakeholders with opportunities to convene, network, and drive thought-leadership through high-quality educational programming.
NIC MAP Vision gives operators, lenders, investors, developers, and owners unparalleled market data for the seniors housing and care sector.