
2Q2021 NIC MAP Seniors Housing Actual Rates Report Key Takeaways
September 2, 2021
The NIC MAP® Data Service, powered by NIC MAP Vision, recently released national monthly data through June 2021 for actual rates and leasing velocity. This report includes national data as well as data for Atlanta, Philadelphia, and Phoenix.
A few of the key takeaways from the 2Q2021 NIC MAP® Seniors Housing Actual Rates Report are listed below. These key takeaways are based on data included in the Segment Type report. Care segments refer to the levels of care and services provided to a resident living in an assisted living, memory care or independent living unit. Full access to the reports and other takeaways is available to NIC MAP Data Service clients.
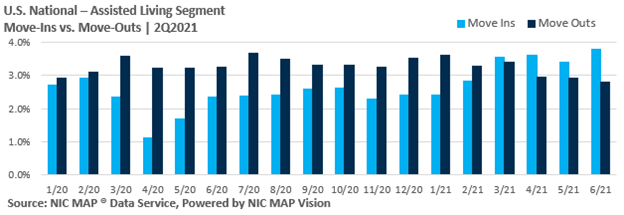
- For all three care segments (independent living, assisted living, and memory care) move-ins outpaced move-outs for four consecutive months from March 2021 through June 2021, showing continued improvement.
- Move-ins for the independent living and assisted living care segments reached their recorded highs in the time series in June 2021. Independent living reached 2.8% of inventory and assisted living reached 3.8% of inventory.
- Move-ins for the memory care segments were also high in 2Q2021 at 4.4% of inventory in June 2021, down from the recorded high of 4.7% of inventory in March of 2021.
- Move-outs slowed in 2Q2021. For the independent living segment, move-outs were at 1.9% of inventory in June 2021. The last time move-outs for independent living were as low as 1.9% was in January 2020. Move-outs for assisted living segments reached the recorded low in the time series of 2.8% in June 2021. Move-outs peaked at 3.7% in July 2020 during the pandemic. Move-outs for memory care segments were at 3.1% for both April and June of 2021, the lowest it has been since September 2018 when it was 3.1%. For memory care, move-outs peaked at 5.3% in July 2020.
- Average initial rates for residents moving into independent living, assisted living and memory care segments were below average asking rates, with monthly spreads largest for memory care.
- The average discount in initial rates for memory care units was 8.6% ($564) in June 2021, up from 6.1% one year earlier in June 2020. This discount of 8.6% equates to 1.0 month on an annualized basis, whereas 6.1% equated to 0.7 month.
- It should be noted that some operators are providing concessions to incentivize move-ins rather than discounts. Examples of concessions could include a free TV upon move-in or a kitchen upgrade. These types of concessions would not be captured in the discounts reported here.
The Actual Rates Data Initiative is driven by the need to continually increase transparency in the seniors housing sector and achieve greater parity to data that is available in other real estate asset types. Now more than ever, with impacts of the COVID-19 pandemic on the sector, having access to accurate data on the actual monthly rates that a seniors housing resident pays as compared to property level asking rates helps the sector achieve this goal.
About the Report
The NIC MAP Seniors Housing Actual Rates Report provides aggregate national data from approximately 300,000 units within more than 2,600 properties across the U.S. operated by 25 to 30 seniors housing providers. The operators included in the current sample tend to be larger, professionally managed, and investment-grade operators as we currently require participating operators to manage 5 or more properties. Note that this monthly time series is comprised of end-of-month data for each respective month.
While these trends are certainly interesting aggregated across the states, actual rates data is even more useful at the metro level. NIC MAP Vision is continuing to work towards reporting more markets.
Interested in Participating?
The Actual Rates Data Initiative is an effort to expand seniors housing data and we are looking for operators who have five or more properties to participate. We have expertise in extracting data from industry leading software systems, such as Yardi, PointClickCare, Alis, and MatrixCare, and can facilitate the process for you.
Your organization benefits through:
- More informed benchmarking, strategic planning, and day-to-day business operations,
- Increased transparency, aligning with other commercial real estate assets in terms of data availability, and
- Enhanced investment and efficiency across the sector.
Learn more by visiting nic.org/actual-rates.
Interested in learning more about NIC MAP data?
To learn more about NIC MAP data, powered by NIC MAP Vision, and about accessing the data featured in this article, schedule a meeting with a product expert today.
—-
This blog was originally published on NIC Notes.
About NIC
The National Investment Center for Seniors Housing & Care (NIC), a 501(c)(3) organization, works to enable access and choice by providing data, analytics, and connections that bring together investors and providers. The organization delivers the most trusted, objective, and timely insights and implications derived from its analytics, which benefit from NIC’s affiliation with NIC MAP Vision, the leading provider of comprehensive market data for senior housing and skilled nursing properties. NIC events, which include the industry’s premiere conferences, provide sector stakeholders with opportunities to convene, network, and drive thought-leadership through high-quality educational programming. To see all that NIC offers, visit nic.org.
NIC MAP Vision gives operators, lenders, investors, developers, and owners unparalleled market data for the seniors housing and care sector.