Beyond National Averages: Using Incidence Data to Find Undersupplied Memory Care Markets
April 28, 2017
“A memory care building binge.” “Oversupply is rampant.” “Memory care is overdeveloped.”
You know the headlines – everyone is worried about oversupply, and the data shows that, in certain markets, memory care oversupply is an issue. Despite these headlines, the reality is that demographics are driving a boom in memory care demand and that supply will have to work hard to keep up. But the question is when and where. The data shows that demand growth is unevenly distributed: the Alzheimer’s Association predicts that the dementia afflicted-population will increase by 56% in Arizona from 2016 – 2025, while increasing only 16% in Iowa.
So the key question facing senior housing operators is how to identify underserved memory care markets and avoid overserved ones?
To answer this question, we’ll start by examining the conventional approach – the standard need analysis. From there, we’ll explore an alternative approach which uses actual prevalence data to identify potentially underserved markets.
The Conventional Approach
First, let’s take a look at the “conventional approach” to evaluating memory care need. It almost always begins with an analysis of the national averages for cognitive impairment in the 75-84, and 85+ populations. Those bands are generally:

These affliction rate by age bands are then multiplied by the population counts in each age band to generate a total “afflicted population.”
The obvious challenge with this approach is that dementia is not evenly distributed – by the Alzheimer’s Associations own estimates, the incidence rate among the 65+ population varies from 1.0% in Utah to 2.5% in Florida. Furthermore, numerous studies have found that certain risk factors including weight, education, alcohol use, tobacco use, and marital status, among other things, create significant elevations in dementia risk. As we all know, these risk factors are not evenly distributed across the country.
So while assuming one affliction rate nationwide may be an easy shorthand, all available evidence suggests that it does not accurately reflect the distribution of dementia need in the United States.
Using Data to Identify Underserved Markets
This raises the obvious question: rather than using a national average to estimate memory care need, why not use actual data on the number of seniors with a cognitive impairment in a specific market area?
To facilitate this level of analysis, there are several key sources of cognitive impairment data available to senior housing industry stakeholders:
- The American Community Survey: this data set, produced by the Census Bureau, provides an annual estimate, at the census tract level, of the number of seniors with a cognitive impairment.
- Medicare Prescription Drug Database: this data set, produced by CMS, provides data on the number of prescriptions written for the brand name and generic dementia medications (i.e. Aricept, etc.).
These two datasets, when combined, can provide greater insight into the actual incidence of dementia, rather than applying a locally-unrepresentative national average to a specific market area.
MSAs w/150k+ Population with Highest & Lowest Dementia Medication Utilization
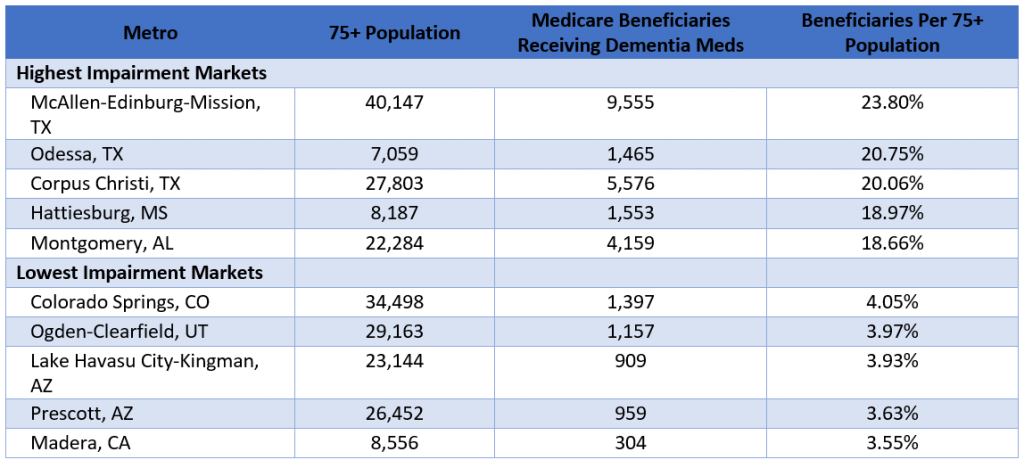
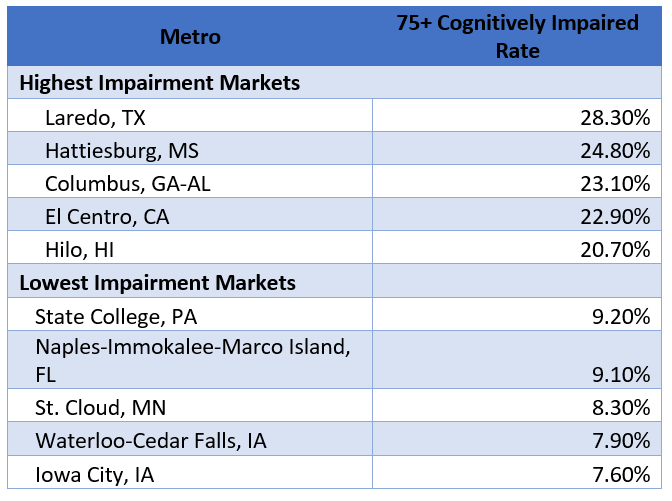
MSAs w/150k+ Population with Highest & Lowest Cognitive Impairment Rate
The Impact of Incidence Variance
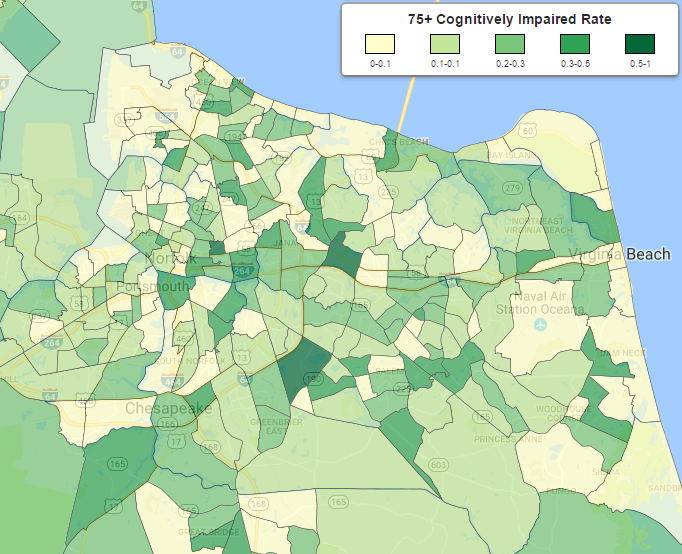 A quick analysis of these two data sets clearly shows a significant variance in “high impairment markets” and “low impairment markets,” as well as a significant variance within any given market area itself. For example, Hattiesburg, MS has one of the nation’s highest 75+ Cognitive Impairment Rates as well as one of the highest percentages of Medicare beneficiaries receiving a dementia medication. In Virginia Beach, the 75+ Cognitive Impairment rate varies from less than 5.0% in the North End to 50.0%+ in Kempsville. In a pure need-driven segment, like memory care, this “impairment variance” can be the difference between success and failure.
So how can senior housing operators use this data to identify underserved memory care markets?
Using Data to Identify Underserved Memory Care Markets – Developing Incidence-Based Metrics
While there are a large number of variables that go into evaluating a memory care market – net worth and income by age, key population growth, and supply base characteristics just to name a few – assessing need is critical to identifying under and oversupplied markets. To do that, we can start by looking at two key metrics:
- Dementia Prescription Beneficiaries Per Memory Care Bed: The number of Medicare beneficiaries receiving a dementia medication per memory care bed in the market area.
- Cognitively Impaired Seniors Per Memory Care Bed: The number of cognitively impaired seniors per memory care bed in the market area.
Both of these metrics provide a good initial estimate of the relationship between supply and potential demand, identifying which markets have the greatest pool of potential customers for each memory care bed. From this starting point, we can then expand upon these metrics to include income qualification, analysis of adult child-driven demand, supply base analysis, and a range of additional filters that are required to fully validate the opportunity.
Metro Areas with the Highest & Lowest Ratio of Cognitively Impaired Seniors Per Memory Care Bed 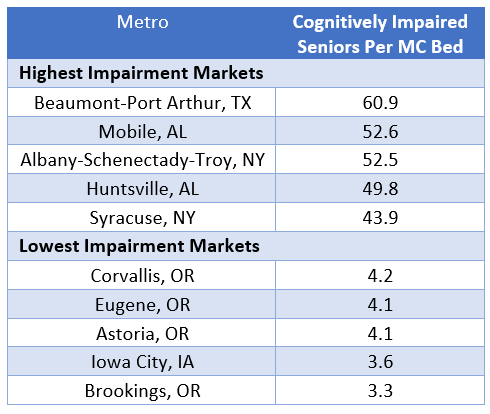
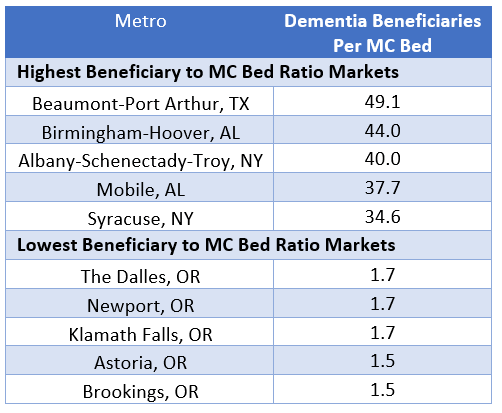
Metro Areas with the Highest & Lowest Ratio of Dementia Beneficiaries Per Memory Care Bed
Applying Need-Based Metrics to Your Market Evaluation
Using a powerful geospatial market analytics platform, like VisionLTC, senior-housing industry stakeholders can calculate these metrics at multiple levels to identify areas of potential opportunity.
- MSA Level: We can analyze MSAs nationwide to identify metro areas with the greatest number of potential customers per available memory care bed. We have provided a snapshot of the metros with the highest and the lowest ratio of dementia beneficiaries and cognitively impaired seniors per memory care bed for a selected group of states above.
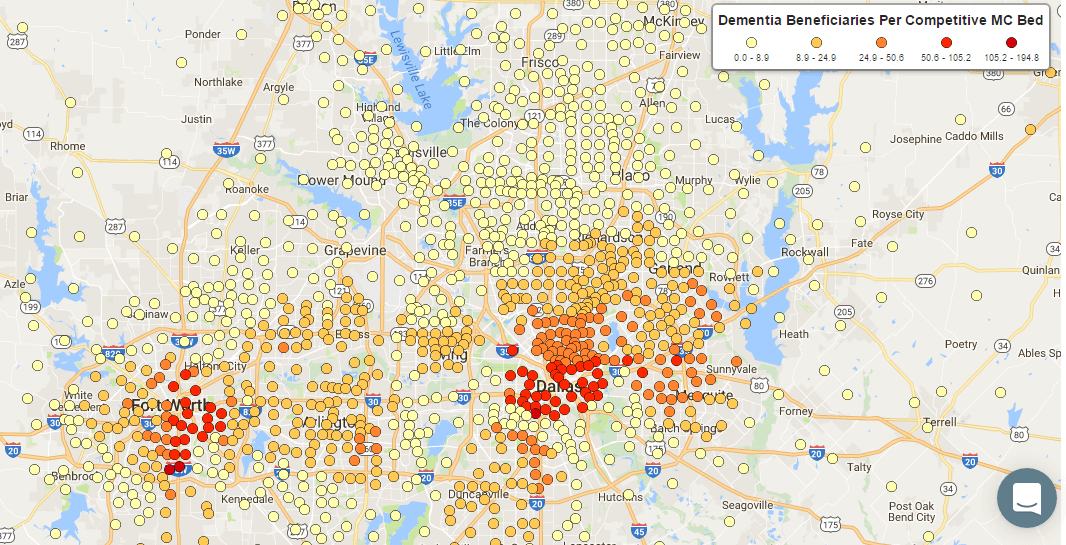
- Submarket Level: We can look at a specific MSA, like Dallas-Fort Worth, and evaluate a thousand plus test sites across the MSA by drawing a 15-minute drive time around each evaluation point and calculating the number of dementia beneficiaries and cognitively impaired seniors per MC bed.
- Site Level: We can look at each of these metrics for a specific site or set of sites. For example, sites in Wilmington, NC show a wide variance in the number of cognitively impaired seniors per memory care bed.
Dallas-Fort-Worth-TX-MSA Dementia Beneficiaries Per Memory Care Bed (15 Minute Drive Time)
While these metrics are just a starting point for identifying market opportunity in memory care, they can be powerful indicators of market opportunity. By supplementing and refining existing analyses with actual incidence data, operators, developers, and financiers can quickly assess metros, submarkets, and specific sites with the greatest number of income qualified seniors with a need for memory care. Using the VisionLTC platform, senior housing industry stakeholders can evaluate markets on these “Incidence-Based Metrics,” among hundreds of others to identify optimal growth opportunities.
Site Level Analysis
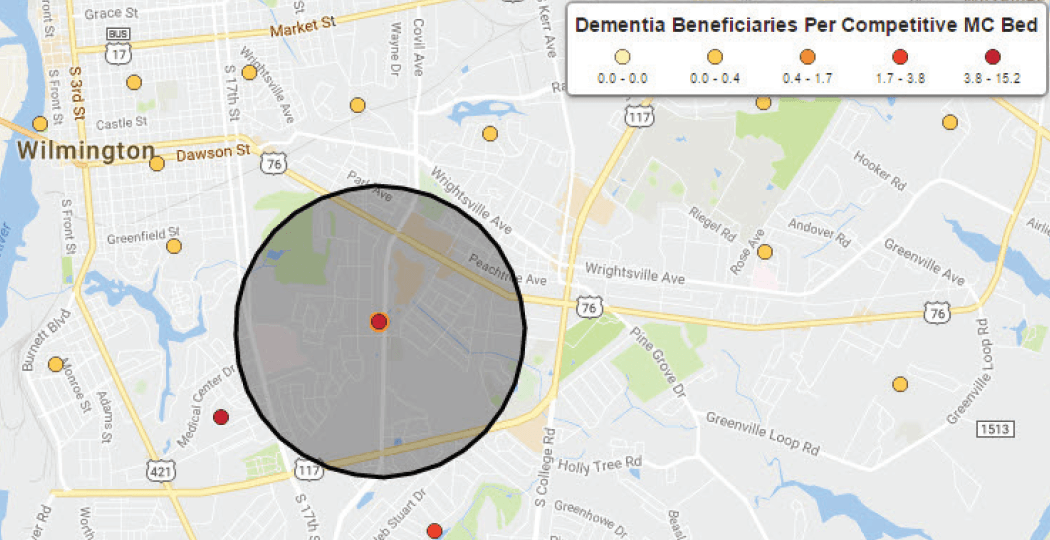 This analysis evaluates multiple sites across the Wilmington, MSA on hundreds of metrics within a 3 mile radius, including the number of dementia beneficiaries per competitive memory care bed. You can note the significant variance in the number of beneficiaries per bed across the market area.
Additional Applications
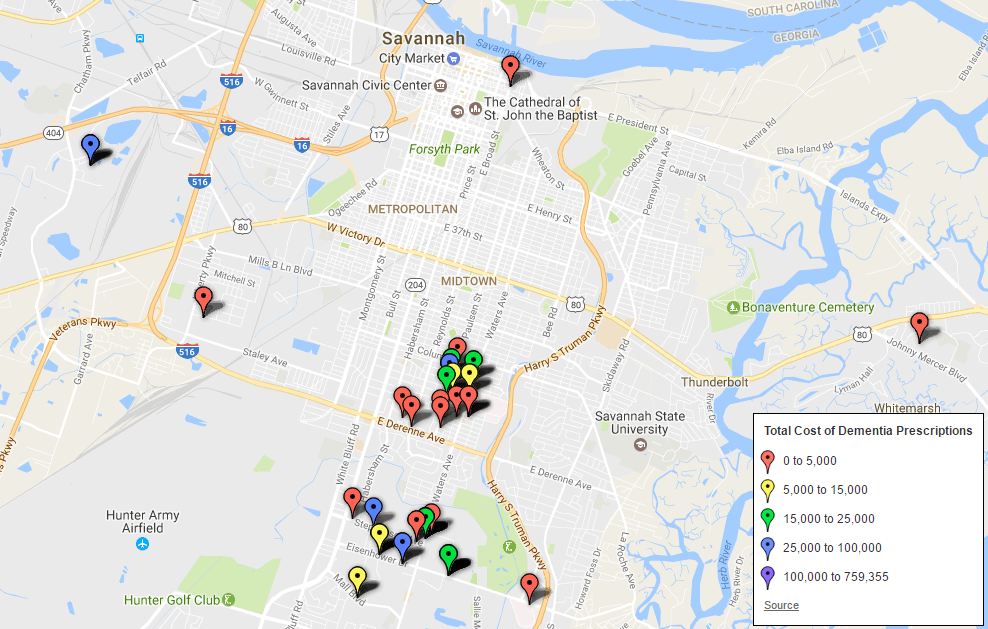
These data sets have an additional benefit as well – they identify prime referral source targets. VisionLTC has developed a referral source management platform, prepopulated with tens of thousands of referral sources nationwide. Included in that dataset are the physicians who prescribe dementia medications and perform dementia screenings. By leveraging this dataset, the VisionLTC platform allows operators to rapidly identify and approach prime memory care referral sources to grow and improve memory care census.
Savannah, GA Memory Care Referral Source Map
VisionLTC is a market analytics software platform that enables users to complete analyses on markets, sites, geographical areas or portfolios of communities on hundreds of senior-housing focused metrics, in just a matter of minutes. We have over 50 years of operating and investing experience in senior housing facilities and we wanted to make a tool that could empower stakeholders to evaluate markets across the United States, identify ideal areas for development and acquisition opportunities, and benchmark communities against their local market and the broader market.
Data Note: Data drawn from Claritas, US Census Bureau, CMS, and State Licensing Databases (for MC Bed Counts)
NIC MAP Vision gives operators, lenders, investors, developers, and owners unparalleled market data for the seniors housing and care sector.

