
CCRC Care Segment Performance 2Q 2022
August 18, 2022
The following analysis examines occupancy and year-over-year changes in inventory, and same-store asking rent growth—by care segment—within CCRCs and non-CCRCs in the 99 combined NIC MAP Primary and Secondary Markets. The analysis also highlights occupancy by payment type (entrance fee CCRCs vs. rental CCRCs), and the relative performance of for-profit CCRCs and not-for-profit CCRCs during the second quarter of 2022—by region.
NIC MAP®, powered by NIC MAP Vision, collects primary data on occupancy, asking rents, demand, inventory, and construction for more than 15,000 independent living, assisted living, memory care, skilled nursing, and continuing care retirement communities (CCRCs—also referred to as life plan communities) across 140 U.S. metropolitan markets. The dataset includes 1,173 not-for-profit and for-profit entrance fee and rental CCRCs in these 140 combined markets, including 1,097 in the 99 combined Primary and Secondary Markets.
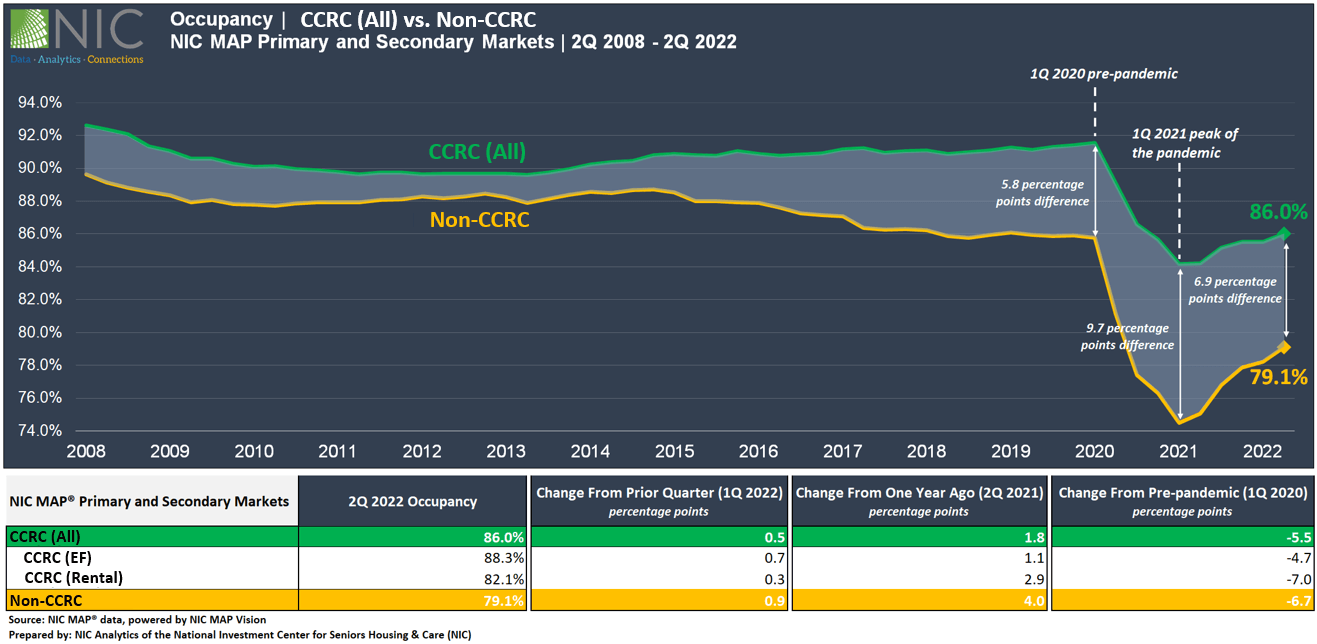
2Q 2022 CCRC Market Fundamentals. CCRC occupancy increased to 86.0% in the second quarter of 2022 for the 99 NIC MAP Primary and Secondary Markets aggregate, up 0.5 percentage points (pps) from the prior quarter, a level 6.9pps above the occupancy rate for non-CCRCs (79.1%).
From its time series low of 84.2% reached in the second quarter of 2021, CCRC occupancy increased by 1.9pps but remained 5.5pps below its pre-pandemic level of 91.5% in the first quarter of 2020. Alternately, non-CCRC occupancy gained 4.0pps from year-earlier levels but still has the most room to make up with a gap of 6.7pps from pre-pandemic level.
In the first quarter of 2020, before the pandemic began to influence the senior housing sector, the gap between CCRC and non-CCRC occupancy rates was 5.8pps. In the second quarter of 2022, the gap between CCRC and non-CCRC occupancy rates stood at about 7.0pps, down 2.8pps from its pandemic high of 9.7pps in the first quarter of 2021 but still 1.1pps wider than it was pre-pandemic.
By Payment Type. In the second quarter of 2022, entrance fee CCRC occupancy (88.3%) was 6.2pps higher than rental CCRCs (82.1%). Compared with the first quarter of 2020, entrance fee CCRCs are now 4.7pps lower, while rental CCRCs remained far below pre-pandemic levels by 7.0pps.
While possible recession scenarios continue to develop, senior housing occupancy continues on the road to recovery, reinforcing confidence and optimism among senior housing constituents. As background, the recently released NIC Intra-Quarterly Snapshot report featuring NIC MAP data, powered by NIC MAP Vision (available for download), showed that the occupancy rate for senior housing (majority independent living and majority assisted living properties) for the 31 NIC MAP Primary Markets increased to 82.0% in the July 2022 reporting period, up 0.7pps from the June 2022 reporting period (2Q 2022) on a three-month rolling basis. This was the largest monthly gain since October 2021.
By Care Segment – CCRCs Maintained Higher Occupancy Rates but Relatively Smaller Asking Rent Growth Compared with Non-CCRCs
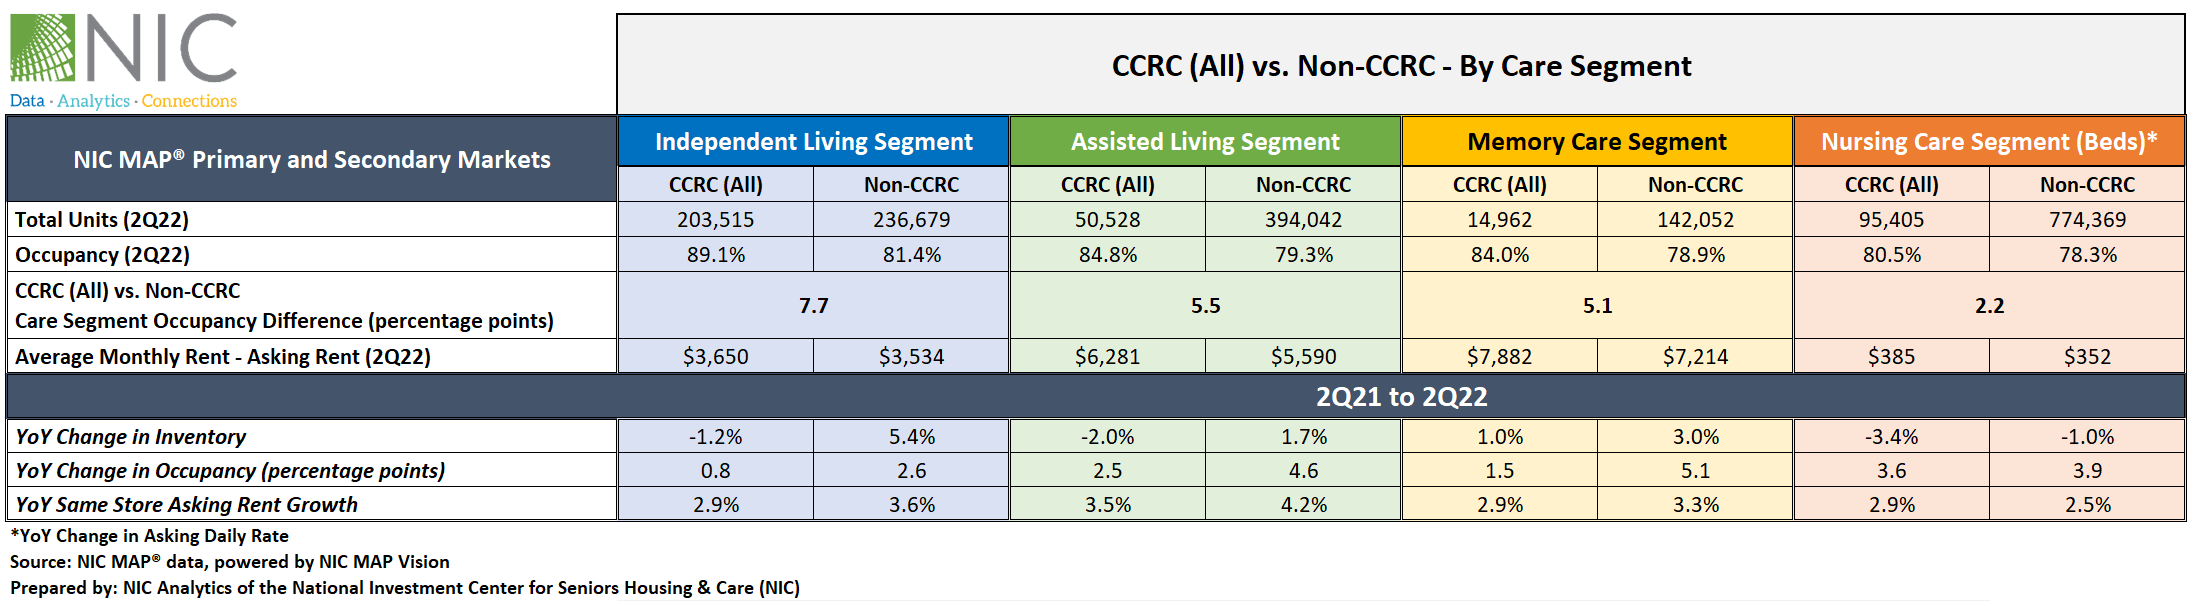
The table below illustrates the relative market performance of CCRCs compared with non-CCRCs by care segment in the second quarter of 2022 and includes year-over-year changes in occupancy, inventory, and asking rent growth. Note that CCRCs often offer both entrance fee and rental contracts to give residents financial choice and flexibility. NIC MAP categorizes CCRC communities by the contract type held by the majority of residents.
Occupancy. Overall, occupancy for CCRCs continued to outpace that of non-CCRCs across all care segments. The difference in second quarter occupancy between CCRCs and non-CCRCs was largest for the independent living segment (7.7pps), and smallest for the nursing care segment (2.2pps).
The CCRC independent living care segment had the highest occupancy (89.1%) in the second quarter of 2022, followed by CCRC assisted living and memory care (84.8% and 84.0%, respectively). Although in terms of occupancy improvements from one year ago, the independent living segment had the smallest gain across all care segments for both CCRCs and non-CCRCs.
Asking Rent. While monthly average asking rent for CCRCs across all care segments remained higher than non-CCRCs, non-CCRCs experienced stronger asking rent growth in the past four quarters, with assisted living reporting the highest year-over-year asking rent growth in the second quarter of 2022 of 4.2%, and nursing care reporting the lowest (2.5%).
Similarly, the highest year-over-year asking rent growth for CCRCs was noted in the assisted living segment (3.5%). Note, these figures are for asking rates and do not consider any discounting that may be occurring.
Inventory. From year-earlier levels, inventory for CCRCs decreased (or shifted) across all care segments except memory care, while non-CCRCs saw increased inventory in all but nursing care. Nursing care inventory for both CCRCs and non-CCRCs decreased by 3.4% and 1.0%, respectively. Negative inventory growth can occur when units/beds are temporarily or permanently taken offline or converted to another care segment, outweighing added inventory.
Historically, CCRCs had reported lower rates of inventory growth (year-over-year change in inventory) by segment than non-CCRCs. In the second quarter of 2022, the highest year-over-year inventory growth was reported for the non-CCRC independent living and memory care segments (5.4% and 3.0%, respectively).
Not-for-Profit CCRC Occupancy is Relatively Higher Compared with For-Profit CCRCs
Among the 1,097 CCRCs spread across the 99 Primary and Secondary Markets tracked by NIC MAP Vision, approximately 70% are operated as not-for-profit, and 30% are operated as for-profit.
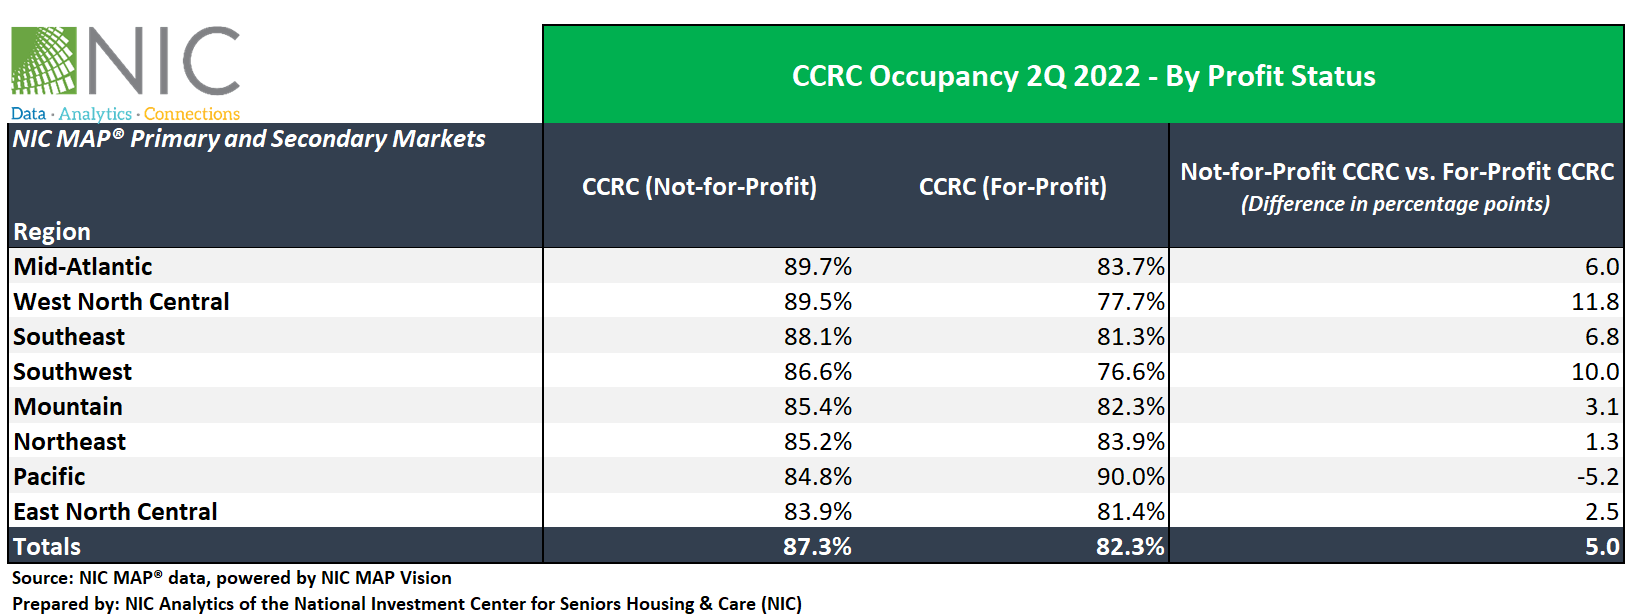
In the second quarter of 2022, not-for-profit CCRC occupancy (87.3%) was 5.0pps higher than that of for-profit CCRCs (82.3%) within the NIC MAP Primary and Secondary Markets. As shown in the table below, not-for-profit CCRCs have higher occupancy rates than for-profit CCRCs across all regions except in the Pacific. The largest differences in the second quarter occupancy between not-for-profit CCRCs and for-profit CCRCs were in the West North Central (11.8pps), followed by the Southwest (10.0pps), and the Southeast (6.8pps).
For not-for-profit CCRCs, the Mid-Atlantic (89.7%), West North Central (89.5%), and Southeast (88.1%) regions had the strongest occupancy rates in the second quarter of 2022. The East North Central region had the lowest occupancy at 83.9%.
For for-profit CCRCs, the Pacific (90.0%), Northeast (83.9%), and Mid-Atlantic (83.7%) regions had the strongest occupancy rates in the second quarter of 2022. The Southwest region had the lowest occupancy at 76.6%.
Look for future blog posts from NIC to delve deep into the performance of CCRCs.
Are you interested in learning more?
To learn more about NIC MAP Vision data, and about accessing the data featured in this article, schedule a meeting with a product expert today.
—-
This blog was originally published on NIC Notes.
About NIC
The National Investment Center for Seniors Housing & Care (NIC), a 501(c)(3) organization, works to enable access and choice by providing data, analytics, and connections that bring together investors and providers. The organization delivers the most trusted, objective, and timely insights and implications derived from its analytics, which benefit from NIC’s affiliation with NIC MAP Vision, the leading provider of comprehensive market data for senior housing and skilled nursing properties. NIC events, which include the industry’s premiere conferences, provide sector stakeholders with opportunities to convene, network, and drive thought-leadership through high-quality educational programming. To see all that NIC offers, visit nic.org.
NIC MAP Vision gives operators, lenders, investors, developers, and owners unparalleled market data for the seniors housing and care sector.