
CCRC Care Segment Performance 4Q 2021
February 13, 2022
The following analysis examines current conditions and year-over-year changes in inventory, occupancy, and same-store asking rent growth—by care segments within entrance fee CCRCs compared to rental CCRCs—to focus a lens on the relative performance of care segments within CCRCs during the fourth quarter of 2021. Overall CCRC occupancy by profit status and CCRC vs. non-CCRC occupancy differences by care segment will also be addressed. Note: this analysis was originally published by Ziegler Investment Banking, Senior Living Finance Z-News for the week of January 31, 2022.
NIC MAP® data, powered by NIC MAP Vision, collects primary data on occupancy, asking rents, demand, inventory, and construction for more than 15,000 independent living assisted living, memory care, skilled nursing, and continuing care retirement communities (CCRCs—also referred to as life plan communities) across 140 U.S. metropolitan markets. The dataset analyzed here includes 1,104 not-for-profit and for-profit entrance fee and rental CCRCs in the 99 combined Primary and Secondary Markets.
4Q 2021 CCRC Market Fundamentals
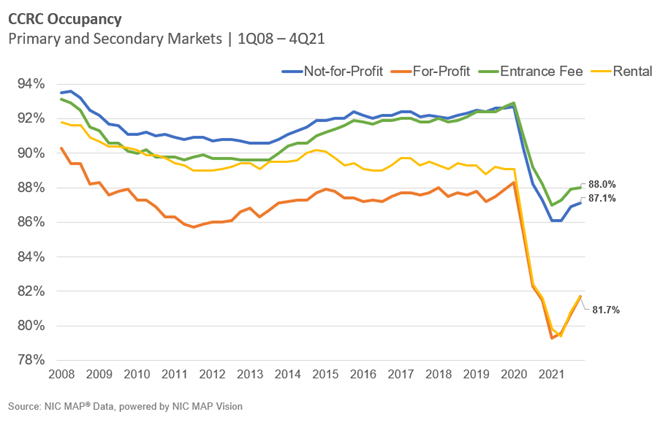
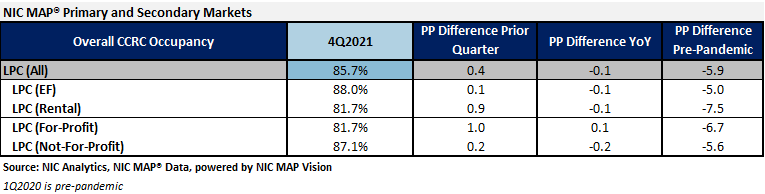
CCRC occupancy reached 85.7% in the fourth quarter of 2021 for the combined 99 Primary and Secondary Markets, 1.4 percentage points above its pandemic low in the first two quarters and 5.8 percentage points below its pre-pandemic occupancy rate in the first quarter of 2020. Currently, CCRC occupancy is equal to the level reached in the fourth quarter one year ago.
In 4Q 2021, entrance fee CCRC occupancy (88.0%) was 6.3 percentage points higher than rental CCRCs (81.7%), and not-for-profit CCRC occupancy (87.1%) was 5.4 percentage points higher than for-profit CCRCs (81.7%). Rental CCRCs are currently 7.4 percentage points below their pre-pandemic occupancy levels, while entrance fee CCRCs are 4.9 percentage points lower.
CCRCs vs. Non-CCRCs: Care Segment Occupancy Difference
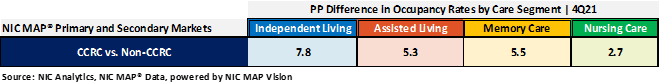
The table below compares occupancy in CCRCs with non-CCRCs for each care segment in the Primary and Secondary Markets tracked by NIC MAP Vision. CCRCs outpaced non-CCRCs in each care segment. The difference in overall occupancy rates was highest for independent living units (7.8 percentage points) and lowest for nursing care units (2.7 percentage points) in 4Q 2021.
Entrance Fee CCRCs vs. Rental CCRCs by Care Segment
Among the 1,104 CCRCs spread across the 99 Primary and Secondary Markets tracked by NIC MAP Vision, approximately 51% are operated as entrance fee CCRCs, and 49% are operated on a rental basis. Referenced in the NIC Investment Guide: Sixth Edition, most CCRC residents initially live in an independent living apartment. CCRCs serve a predominately single-female population, however, entrance fee CCRCs have a higher percentage of married couples (42%) than rental CCRCs (29%).
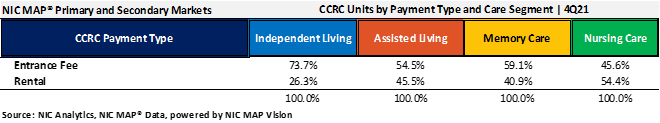
The table below illustrates the relative market performance of entrance fee CCRCs compared to rental CCRCs by care segment in 4Q 2021 and includes year-over-year changes in occupancy, inventory, and asking rent growth. Note that CCRCs often offer both entrance fee and rental contracts to give residents financial choice and flexibility. NIC categorizes CCRC communities by the contract type the majority of residents have.
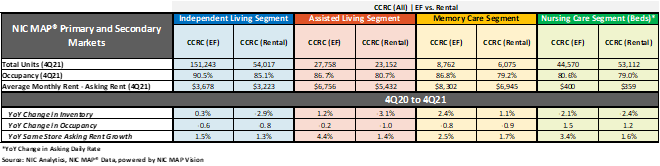
Entrance Fee CCRCs Have Higher Occupancy Rates and Stronger Rent Growth and Inventory Growth. By payment type, entrance fee CCRCs have higher 4Q 2021 occupancy rates than rental CCRCs for each care segment. The entrance fee CCRC independent living care segment had the highest 4Q 2021 occupancy (90.5%), followed by entrance fee CCRC assisted living and memory care (86.7% and 86.8%, respectively). The difference in 4Q 2021 occupancy between entrance fee CCRCs and rental CCRCs was the highest for the memory care segment (7.5 percentage points), followed by assisted living (6.0 percentage points), independent living (5.4 percentage points), and nursing care (1.6 percentage points). On a year-over-year basis, the nursing care segment had the most substantial change in occupancy (up 1.5 and 1.2 percentage points, respectively).
As shown in the table below, entrance fee CCRCs are comprised of a greater proportion of independent living units. Independent living occupancy is higher than in the other care segments, explaining the more robust overall occupancy performance of entrance fee CCRCs.
CCRCs attract residents who are planners drawn to the continuum of care. However, entrance fee contract residents generally differ from rental contract residents in terms of higher net worth, lower age of entry, and longer tenure in the community. CCRC entrance fees (often similar to resident home sales values) typically subsidize a community’s monthly fees to some extent. Conventional wisdom would suggest that average rental CCRC monthly fee levels would therefore be higher. However, as shown in the table, in addition to higher occupancy rates—which tend to translate into community pricing power—any or all of these factors may help to explain the reasons why average entrance fee CCRC monthly fee levels are higher than rental CCRC monthly fees for each care segment.
The highest year-over-year asking rent growth was in the entrance fee CCRC assisted living segment (4.4%), followed by nursing care (3.4%) and memory care (2.5%). Entrance fee and rental CCRC asking rent growth were similar in the independent living segment. Note these figures are for asking rates and do not consider any discounting that may be occurring.
The number of units in a community differs significantly by payment model. Referenced in the NIC Investment Guide: Sixth Edition, the median size of entrance fee CCRCs is approximately 345 units, compared to 230 units for rental CCRCs. According to the NIC MAP Vision data, both entrance fee and rental CCRCs experienced negative year-over-year inventory growth in one or more care segments. Negative inventory growth can occur when units/beds that are temporarily or permanently taken offline or converted to another care segment outweigh added inventory.
During the past four quarters, rental CCRCs reduced (or shifted) their inventory in each care segment except memory care. Entrance fee CCRCs increased their inventory in all but nursing care. Both entrance fee and rental CCRCs reduced nursing care inventory by -2.1% and -2.4%, year-over-year. Rental CCRCs had the highest reduction in their inventory for the assisted living care segment (-3.1%), while entrance fee CCRCs added 1.2% to their assisted living inventory. Entrance fee CCRCs added more memory care than rental CCRCs (2.4% vs. 1.1%). Rental CCRCs reduced (or shifted) more independent living than entrance fee CCRCs (-2.9% vs. 0.3%).
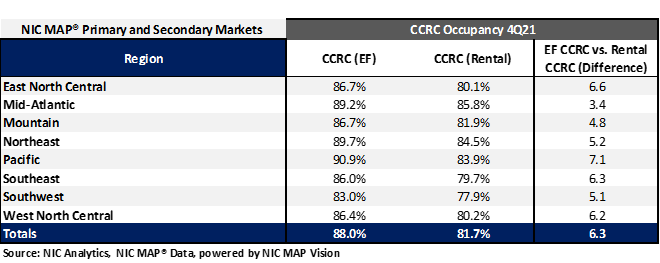
Entrance Fee CCRC Occupancy is Highest in the Pacific Region. In 4Q 2021, the Pacific, Mid-Atlantic, and Northeast regions had the strongest CCRC occupancy rates ranging from 88.5% to 88.2%. The weakest CCRC occupancy was in the Southwest region at 80.8%. Considering payment type, as shown in the table below, entrance fee occupancy was highest in the Pacific region (90.9%), whereas rental occupancy was the highest in the Mid-Atlantic region (85.8%). The most significant difference between entrance fee and rental occupancy was reported for the Pacific region, where entrance fee CCRC occupancy was 7.1 percentage points higher than rental.
Look for future blog posts from NIC to delve deep into the performance of CCRCs.
Are you interested in learning more?
To learn more about NIC MAP® data, powered by NIC MAP Vision, and about accessing the data featured in this article, schedule a meeting with a product expert today.
—-
This blog was originally published on NIC Notes.
About NIC
The National Investment Center for Seniors Housing & Care (NIC), a 501(c)(3) organization, works to enable access and choice by providing data, analytics, and connections that bring together investors and providers. The organization delivers the most trusted, objective, and timely insights and implications derived from its analytics, which benefit from NIC’s affiliation with NIC MAP Vision, the leading provider of comprehensive market data for senior housing and skilled nursing properties. NIC events, which include the industry’s premiere conferences, provide sector stakeholders with opportunities to convene, network, and drive thought-leadership through high-quality educational programming. To see all that NIC offers, visit nic.org.
NIC MAP Vision gives operators, lenders, investors, developers, and owners unparalleled market data for the seniors housing and care sector.