
Five Key Takeaways from the NIC MAP Second Quarter 2021 Seniors Housing Data Release Webinar
July 28, 2021
NIC MAP Vision clients, with access to NIC MAP® Data, attended a webinar in mid-July on key seniors housing data trends during the second quarter of 2021. Findings were presented by the NIC Analytics research team. Key takeaways included the following:
Takeaway #1: Seniors Housing Occupancy Unchanged in 2Q 2021
-
The occupancy rate for seniors housing was unchanged at 78.7% in the second quarter. The flat occupancy rate hides the fact that there was a pickup in demand in the second quarter, however.
-
Indeed, despite unchanged occupancy, demand for senior housing improved in the second quarter. Net absorption – the number of units leased on a net basis – was positive in the second quarter (3,514) marking the first positive quarterly absorption since the first quarter of 2020 and the most positive absorption since 2019. Second quarter data confirms anecdotes that occupancy at many properties improved as move-ins accelerated thanks to limited property-level COVID-19 infections.
-
The flat occupancy rate was largely due to new inventory coming online which in turn reflected the number of projects that broke ground pre-COVID that finished construction and opened in the second quarter. There were 4,275 units that came online in the Primary Markets during the second quarter.
Takeaway #2: Secondary Markets Occupancy Increased in 2Q 2021
-
NIC MAP defines Secondary Markets as Markets 32 through 99 and comprise 68 large core based statistical areas (CBSAs) in the continental U.S. Each of these is generally smaller in population than any single one of the 31 Primary Markets.
-
In contrast to the Primary Markets, the occupancy rate rose in the second quarter of 2021 for the Secondary Markets, increasing by 0.8 percentage point to 80.0%. This was because, unlike in the Primary Markets, inventory growth did not overwhelm the improvement in net absorption due to the relatively small gain in inventory of 840 units versus absorption (3,402 units).
-
Importantly, note that net absorption increased at its fastest pace on record except for the fourth quarter of 2019, just before the pandemic.
-
It is also interesting to note that the overall drop in occupancy in the Secondary Markets was 8.0 percentage points from peak to trough versus the 8.7 percentage point drop from peak to trough for the Primary Markets.
Takeaway #3: Some Markets Continue to See Strong Levels of Construction
-
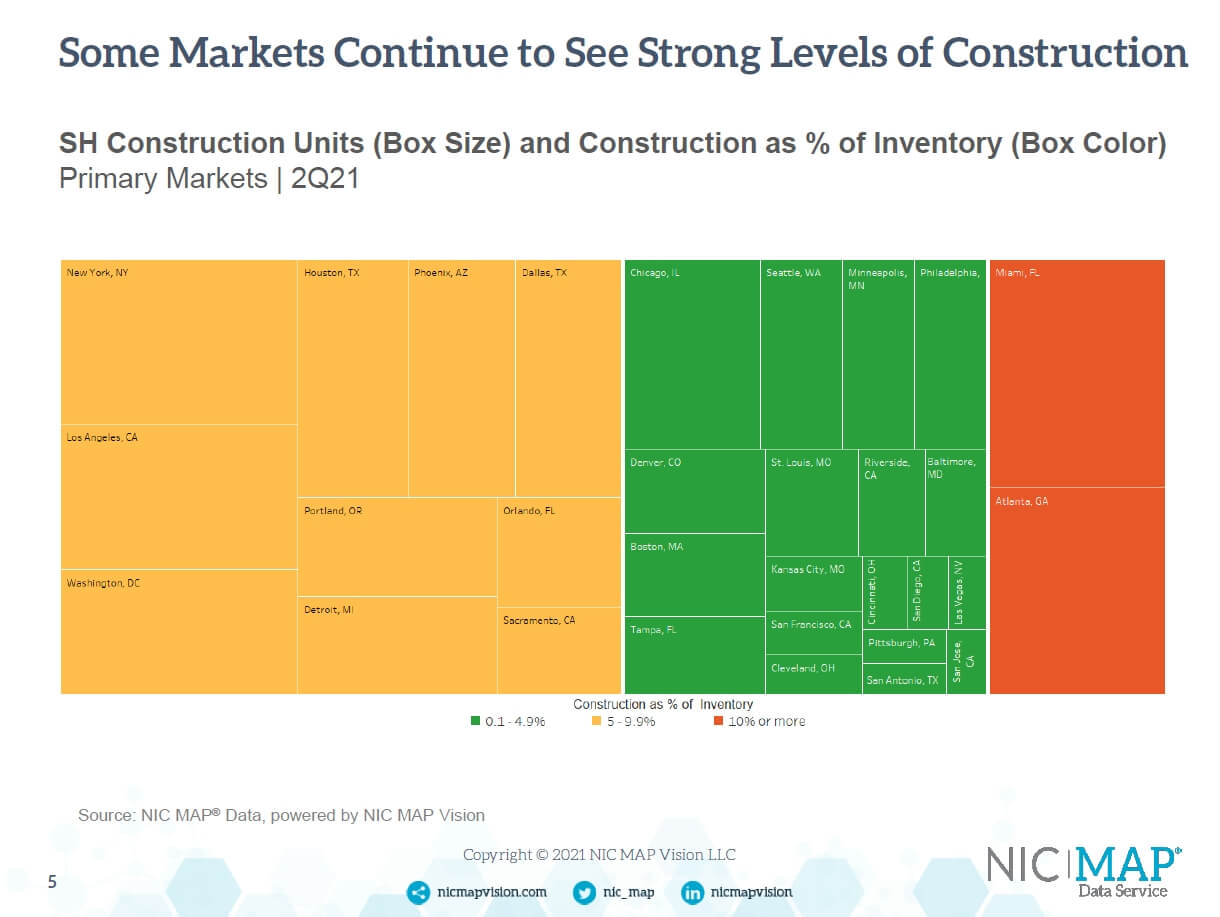
Miami, Atlanta, Washington D.C., Houston, and Phoenix are markets where there is a lot of construction currently underway. The tree map below demonstrates this.
-
This tree map that shows the level of construction activity underway as well as construction as a share of inventory for each of the 31 NIC MAP Primary markets. The size of the box shows the absolute number of units under construction, while the color—yellow, orange, and green—indicate seniors housing construction as a share of inventory for each of the 31 Primary Markets. The scale ranges from 0% to 4.9% —green—to 5.0% to 9.9%—yellow—to 10.0% or more—–orange. For perspective and for the Primary Markets, construction as a share of inventory was 5.0% (yellow or roughly 34,000 units) in the second quarter.
-
On the far right, in bright orange, are markets where construction as a share of inventory exceeds 10%. This includes Atlanta and Miami.
-
On the far left, in lighter shades of orange, are markets with the largest absolute number of units under construction. This includes Houston, Washington D.C., and Phoenix. LA and NY are also part of this grouping.
-
This suggests that D.C. and Miami, as well as Atlanta, Houston, and Phoenix may be more challenged as these units open and the demand-side effects of the pandemic on demand wear off in the coming months.
Takeaway #4: Some Markets See Rise from Record Occupancy Lows
-
The inventory patterns at the metro area have impacted the overall occupancy rates of their respective geographies. Twelve markets had occupancy rates higher than the Primary Market average of 78.7%. The markets with the highest second-quarter senior living occupancy rates were San Jose at 83.7%, followed by Portland, San Francisco, and Seattle.
-
Note, however, that there was a significant drop in these occupancy rates from one year ago. The occupancy rate in San Jose is down a full 8.6 percentage points from the second quarter of 2020 and going back to the pre-pandemic Q1 2020, it is down 11.1 percentage points, albeit better than the 11.5 percentage point loss in the first quarter—however, note that there was a 0.4 percentage point improvement in occupancy in San Jose in the second quarter.
-
In fact, of the 31 markets that comprise the Primary Markets, all but seven saw improvements or no change in occupancy in the second quarter from the first quarter. Markets that saw continued deterioration included San Francisco, San Diego, Pittsburgh, Sacramento, Baltimore, San Antonio, Las Vegas, and Chicago.
-
The market with the lowest second quarter 2021 occupancy rate was Houston at 73.0%, followed by Atlanta, Las Vegas, Cleveland, and Riverside.
-
In all, nineteen markets had occupancy rates below the national average of 78.7%.
Key Takeaway #5: Will Seniors Housing Pricing Return to Pre-Pandemic Peak?
-
The price per unit (PPU) for seniors housing has continued to increase from its pandemic low in the third quarter of 2020 and has now increased for three quarters, including the second quarter of 2021.
-
Seniors housing increased by 7.3% in the second quarter of 2021 from the first quarter, from $168,100 to $180,300. However, year-over-year, seniors housing price per unit was down 4.7%.
-
The price per nursing care bed decreased slightly quarter-over-quarter but it has increased 19% compared to one year ago in the second quarter of 2020. It ended the second quarter of 2021 at $90,300.
-
For skilled nursing, price per bed has been increasing during the pandemic and many aggressive private buyers bid higher to win deals, and skilled nursing still, given the higher yields and cap rates, represents a relatively high expected return especially given the low interest rates we continue to see. There is very strong interest from private buyers still holding pricing firm for now.
-
For seniors housing, many of the deals closing now were underwritten months ago and it seems we are still seeing an increase in the price per unit. The expectation from many in the markets is we will see pricing continue to increase as buyers bid more aggressively and get comfortable with a continued recovery in occupancy, and therefore an expected improvement in net operating income as well.
-
Note that the transactions data reported in the webinar is only the closed property sales transactions throughout the United States. It does not include deals that have been announced in the quarter and not yet closed. It is also important to remember that this data is preliminary for the second quarter of 2021 as data could be updated with other deals being captured as we learn about their closings. These updates typically occur as public records become available.
Interested in learning more?
While the full key takeaways presentation is only available to NIC MAP clients with access to NIC MAP data, you can access the abridged version of the 2Q21 Data Release Webinar & Discussion featuring my exclusive commentary below. View the Abridged Slides
To learn more about NIC MAP data, powered by NIC MAP Vision, an affiliate of NIC, and accessing the data featured in this article, schedule a meeting with a product expert today.
—-
This blog was originally published on NIC Notes.
About NIC
The National Investment Center for Seniors Housing & Care (NIC), a 501(c)(3) organization, works to enable access and choice by providing data, analytics, and connections that bring together investors and providers. The organization delivers the most trusted, objective, and timely insights and implications derived from its analytics, which benefit from NIC’s affiliation with NIC MAP Vision, the leading provider of comprehensive market data for senior housing and skilled nursing properties. NIC events, which include the industry’s premiere conferences, provide sector stakeholders with opportunities to convene, network, and drive thought-leadership through high-quality educational programming. To see all that NIC offers, visit nic.org.
NIC MAP Vision gives operators, lenders, investors, developers, and owners unparalleled market data for the seniors housing and care sector.