
Market Fundamentals Amid Challenging Time for Skilled Nursing
May 13, 2022
It is no surprise that the COVID-19 pandemic had a tremendous impact on skilled nursing occupancy. But what exactly happened? This article provides the insights on supply and demand dynamics and the disparities between property level occupancy rates for freestanding skilled nursing properties.
Demand and Supply Dynamics for Freestanding Skilled Nursing Properties (2017 – 2022)
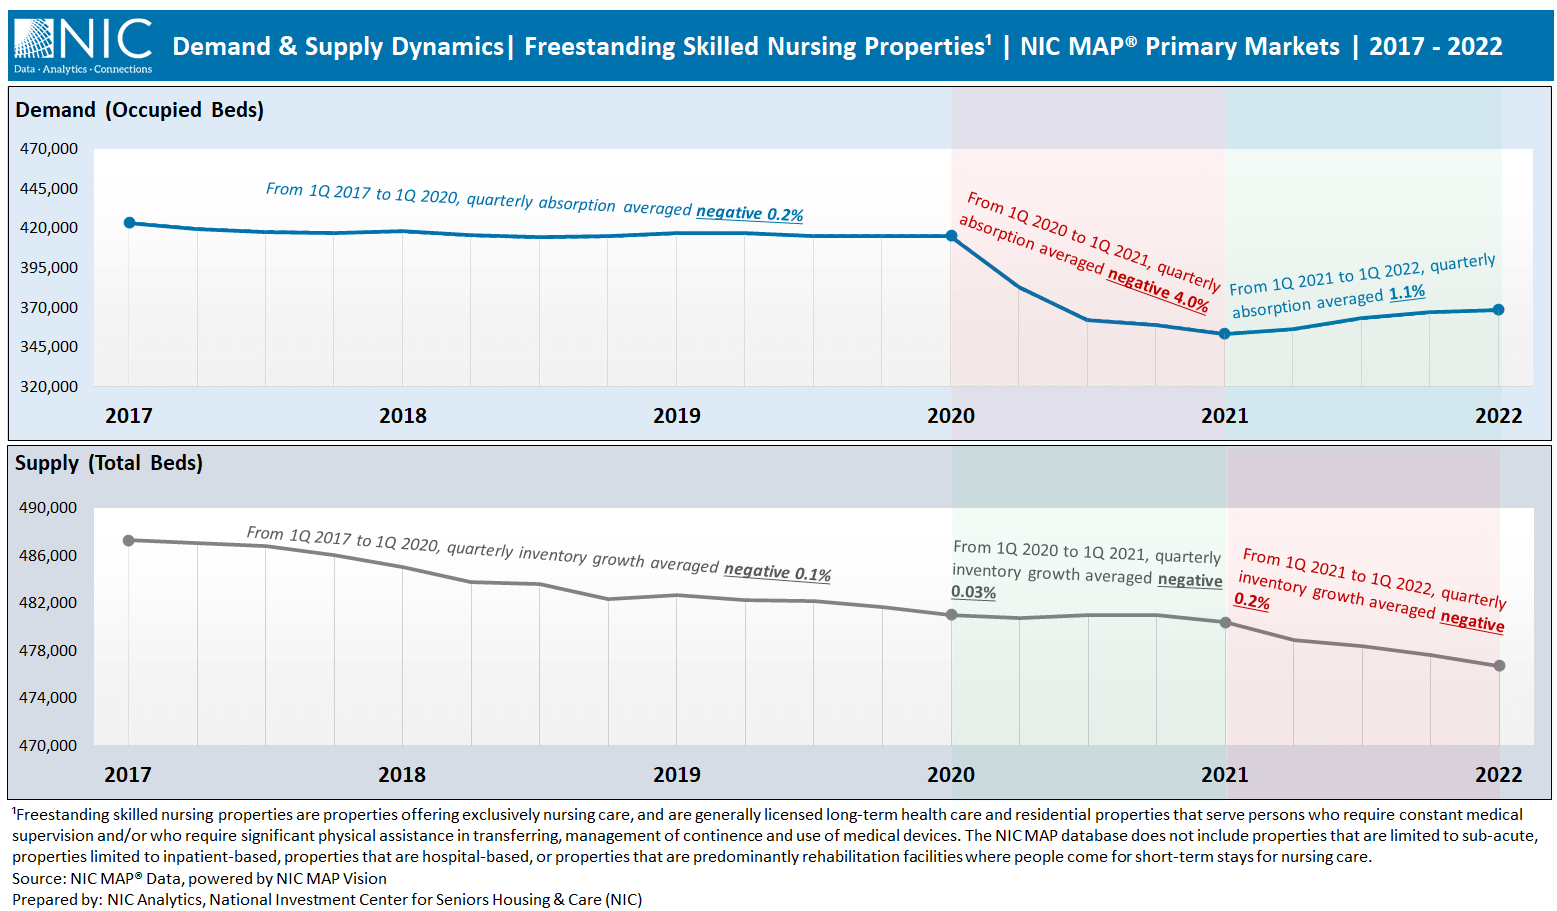
The COVID-19 pandemic caused an unprecedented global health crisis and human tragedy. Among the most affected groups and property types were older frail adults and skilled nursing properties. Indeed, the health crisis led to a dramatic loss in occupied beds for the skilled nursing sector. From the first quarter of 2020 to the first quarter of 2021, demand, as measured by occupied stock or the change in net absorption, fell by about 62,000 beds on a net basis for freestanding skilled nursing properties for the 31 NIC MAP® Primary Markets aggregate. This was equivalent to 15% of the pre-pandemic (1Q 2020) occupied bed stock. Net absorption rates averaged about negative 4% on a quarterly basis over this four-quarter period.
Subsequently, beginning in the first quarter of 2021 through first quarter 2022, demand patterns reversed course and the net absorption rate averaged 1.1% on a quarter-to-quarter basis — equivalent to over 15,350 beds absorbed on a net basis over this four-quarter period. Notably, 25% of the occupied beds lost for the Primary Markets aggregate during the first year of the pandemic (1Q 2020 to 1Q 2021) had been recovered during the second year of the pandemic (1Q 2021 to 1Q 2022). While this was a very welcome positive trend and does indicate light on the horizon, the sector continues to face concerning financial challenges unfortunately for a number of reasons. These reasons include very low occupancy rates, Medicare funding cuts and underfunding of Medicaid reimbursement in many states, incrementally higher expenses, and staggering staffing shortages restricting admissions of residents into some skilled nursing properties.
Interestingly, however, as Exhibit 1 below shows, supply and demand for freestanding skilled nursing properties were contracting even prior to the pandemic. Based on historical data since 2017, quarterly net absorption rates and inventory growth averaged negative 0.2% and negative 0.1%, respectively, over the period from 1Q 2017 to 1Q 2020, the three years preceding the pandemic.
Further, the data show that during the height of the pandemic and prior to widespread vaccination among residents (from 1Q 2020 to 1Q 2021), the decline in inventory for skilled nursing properties continued but at a much slower pace compared with historical patterns and averaged negative 0.03% quarter-to-quarter, less than one third the rate at which inventory had been declining prior to the pandemic (negative 0.1%).
Exhibit 1 – Supply & Demand Dynamics – Freestanding Skilled Nursing Properties
The question is, why did this slowdown in the loss of skilled nursing beds occur during the first year of the pandemic? Perhaps fewer beds were taken offline because bed capacity was simply needed during the height of the pandemic to take care of the unprecedented numbers of ill older adults.
In hindsight, skilled nursing properties generally stood their ground and navigated through extremely uncertain and decentralized responses to COVID-19 when they were needed the most to care for individuals at high-risk for severe illness from COVID-19 and went even further by accepting COVID-19 patients from overwhelmed hospitals in many states.
During the second year of the pandemic (1Q 2021 to 1Q 2022), skilled nursing inventory decline accelerated once again, averaging negative 0.2% quarter-to quarter, twice the rate recorded prior to the pandemic (negative 0.1% quarter-to-quarter over the three years leading up to the pandemic, from 1Q 2017 to 1Q 2020), and nearly seven times the rate recorded during the first year of the pandemic (negative 0.03% quarter-to-quarter over the period from 1Q 2020 to 1Q 2021).
While vaccines have proven to be effective at limiting severe illness, hospitalizations, and fatalities from COVID-19, and the level of agility, preparedness and responsiveness among skilled nursing properties has never been higher, these statistics show that inventory nonetheless contracted during the second year of the pandemic. The inventory decline may have been the result of:
- Closures due to inadequate funding leading to financial stress among some operators amid very low occupancy rates and incrementally higher expenses,
- A move to more private rooms thereby removing some bed capacity at properties, and
- The staffing shortages limiting admissions and occupancy recovery.
Occupancy Overview – Freestanding Skilled Nursing Properties
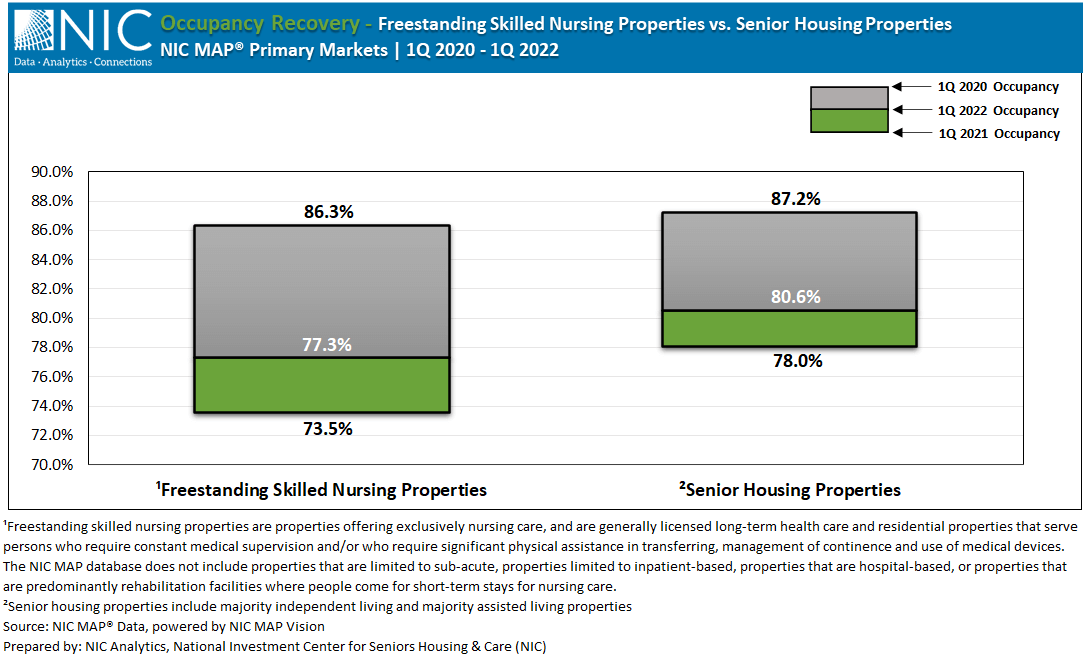
Since the outbreak in early 2020, the COVID-19 pandemic has challenged every aspect of the skilled nursing sector. In the span of one year, occupancy for freestanding skilled nursing properties for the Primary Markets fell 12.8 percentage points, from 86.3% in 1Q 2020 to a record low of 73.5% in 1Q 2021. Since then, occupancy climbed to 77.3% in 1Q 2022, up 3.8 percentage points from its lowest level but remaining 9.0 full percentage points below 1Q 2020 pre-pandemic levels. Additionally, 21% of freestanding skilled nursing properties reported an occupancy rate in 1Q 2022 at or above pre-pandemic 1Q 2020 levels, according to NIC MAP® data.
The occupancy loss for skilled nursing in the Primary Markets during the first year of the pandemic was mainly a function of a demand contraction. Whereas the occupancy loss for the private pay senior housing sector over the same period was a function of both an increase in supply and a decrease in demand. As background, occupancy for private pay senior housing properties for the Primary Markets fell by 9.2 percentage points from 1Q 2020 to 1Q 2021, 3.6 percentage points less than skilled nursing.
While the uncertainty bands remain wide in terms of when occupancy rates for skilled nursing properties will return to pre-pandemic levels, a key question is whether obtaining a sustainable level of occupancy and revenue growth will be sufficient to grow NOI and recoup the losses from the severe downturn in occupancy rates, the incrementally higher expenses, and inflationary impact associated with the pandemic.
Exhibit 2 – Occupancy Recovery – Freestanding Skilled Nursing Properties vs. Senior Housing Properties
Occupancy Distribution
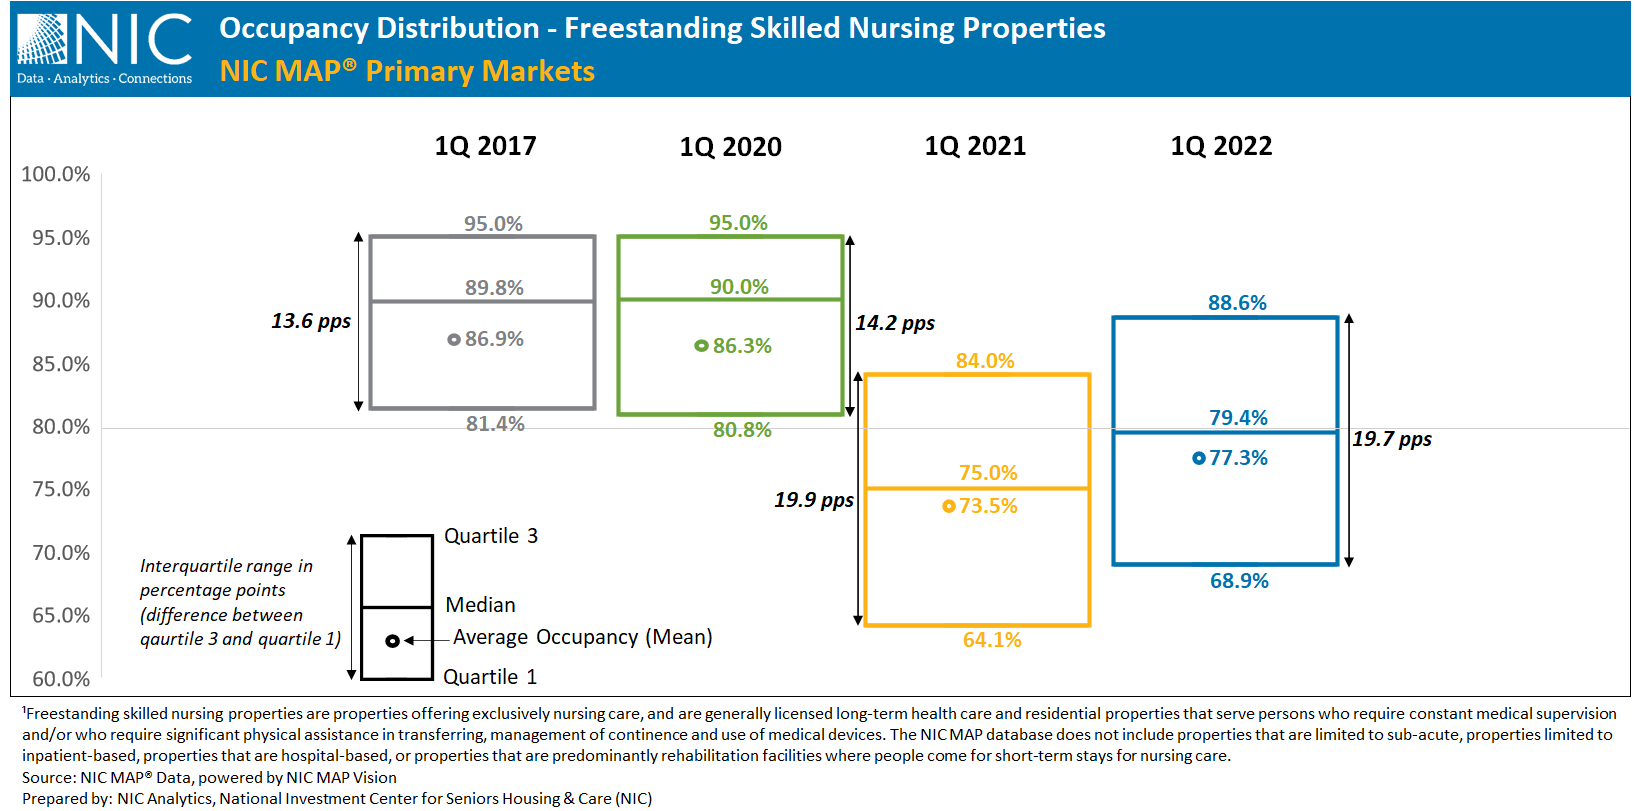
Average occupancy rates provide a window into an overall market’s performance. But in a time of severe and prolonged downturn, it is important to assess occupancy distribution to get a better understanding of property level performance. Exhibit 3 below depicts occupancy distribution for freestanding skilled nursing properties for the Primary Markets aggregate.
The pandemic triggered significant disparities between property level occupancy rates. For example, the spread between quartile 3 property level occupancy rates and quartile 1 (known as the interquartile range, which represents the middle 50% of the data), jumped to roughly 20 percentage points in 1Q 2021, the highest it has been since NIC MAP began reporting the data in 2005. In 1Q 2020 before the pandemic began to influence the skilled nursing sector, the interquartile range was relatively smaller at 14.2 percentage points, 5.7 percentage points below 1Q 2021.
Further, 75% of freestanding skilled nursing properties within the Primary Markets had an occupancy rate equal to or above 80.8% (quartile 1) in 1Q 2020, as depicted in the box plot in Exhibit 3 below. At the height of the pandemic in 1Q 2021 and based on the detailed distribution compiled by NIC Analytics, only 35% of skilled nursing properties had an occupancy rate above 80%, 15% had occupancy between 80% and 75%, and 50% had an occupancy rate below 75% (median), including 25% of properties with an occupancy rate below 64.1% (quartile 1).
In 1Q 2022, as demand increased for four consecutive quarters, the share of properties with occupancy rates above 80% grew to about 50% (median 79.4%). While 1Q 2022 stats have improved, 25% of skilled nursing properties continue to experience occupancy below 68.9% (quartile 1). Owners of these properties may find access to capital challenging since many may have been relying on COVID-19 era policies to support operations.
Exhibit 3 – Occupancy Distribution – Freestanding Skilled Nursing Properties
The recent improvements in skilled nursing market fundamentals have demonstrated that vigilance and preparedness among skilled nursing properties are key elements for protecting staff and residents from COVID-19 and restoring occupancy.
Methodology
In this analysis based on NIC MAP data, powered by NIC MAP Vision, we discuss recent market fundamentals for the skilled nursing sector and how it is faring after two years of the pandemic. We evaluate supply and demand dynamics for freestanding skilled nursing properties within the 31 NIC MAP Primary Markets (Primary Markets) since 2017. Additionally, we examine property-level occupancy distribution to get a better understanding of how widespread the effects of the pandemic have been.
The analysis examined approximately 4,000 freestanding skilled nursing properties within the Primary Markets. Note that combined properties offering at least two types of service and life plan communities (LPCs)/continuing care retirement communities (CCRCs) were excluded from this analysis.
—-
This blog was originally published on NIC Notes.
About NIC
The National Investment Center for Seniors Housing & Care (NIC), a 501(c)(3) organization, works to enable access and choice by providing data, analytics, and connections that bring together investors and providers. The organization delivers the most trusted, objective, and timely insights and implications derived from its analytics, which benefit from NIC’s affiliation with NIC MAP Vision, the leading provider of comprehensive market data for senior housing and skilled nursing properties. NIC events, which include the industry’s premiere conferences, provide sector stakeholders with opportunities to convene, network, and drive thought-leadership through high-quality educational programming. To see all that NIC offers, visit nic.org.
NIC MAP Vision gives operators, lenders, investors, developers, and owners unparalleled market data for the seniors housing and care sector.