NIC MAP Vision 3Q23 Key Takeaways: Senior Housing Occupancy Rate Increases for Ninth Consecutive Quarter
October 31, 2023
NIC MAP Vision clients, with access to NIC MAP® data, attended a webinar in mid-October on key senior housing data trends during the third quarter of 2023. Findings were presented by the NIC Analytics research team. Key takeaways included the following:
Takeaway #1: Market Fundamentals on Track for Occupancy Recovery
- The occupancy rate for senior housing—where senior housing is defined as the combination of the majority independent living and assisted living property types—rose 0.8 percentage points to 84.4% from the second quarter of 2023 to the third quarter for the 31 NIC MAP Primary Markets. This marked the ninth consecutive quarter of occupancy increases.
- At 84.4%, occupancy is 6.6 percentage points above its pandemic-related low of 77.8% recorded in mid-2021 and 2.7 percentage points below its pre-pandemic level of 87.1% of the first quarter of 2020.
- Demand in the third quarter as measured by the change in occupied inventory, or net absorption, totaled 7,853 units in the 31 Primary Markets, which was nearly three times the 2,806 units that arrived online during that same period. Demand has been positive over the past 10 quarters, which has helped occupancy to improve.
Takeaway #2: Majority Independent Living Occupancy Gains Accelerated in Third Quarter
- In the third quarter of 2023, the occupancy rate for assisted living increased by 0.9 percentage points to 82.6%. Meanwhile, after hovering around the 85% range for three consecutive quarters, the occupancy rate for independent living in the third quarter jumped by 0.7 percentage points to 86.1%.
- Despite this jump, this was still the ninth consecutive quarter (i.e., the entirety of the pandemic recovery thus far) in which occupancy gains were stronger for assisted living than for independent living. As a result, the occupancy gap between the two stood at only 3.5 percentage points in the third quarter, which was smaller than the 4.9 percentage point gap recorded before the onset of the pandemic.
Takeaway #3: Annual Inventory Growth Remained Low
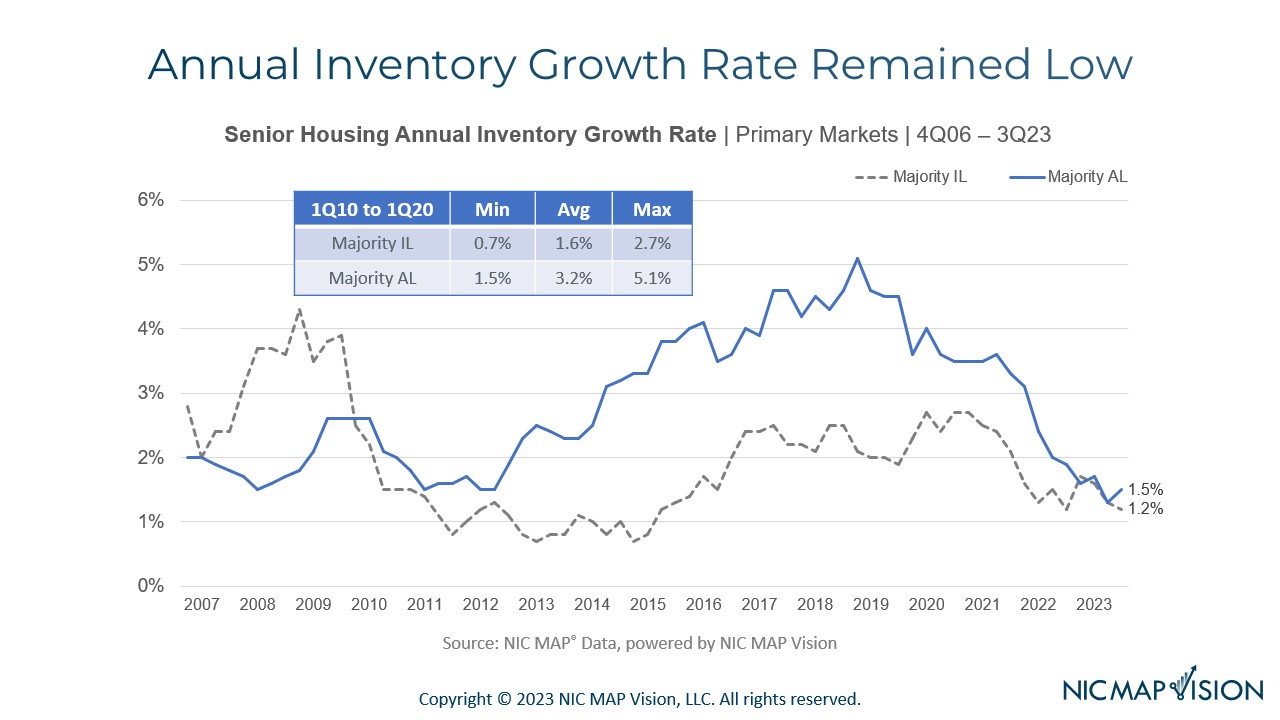
- In the chart below, we show annual inventory growth as a percentage of existing inventory.
- By property type, annual inventory growth in the third quarter for independent living was 1.2%, below its pre-pandemic average of 1.6%.
- Assisted living in the third quarter grew by a slightly higher amount at 1.5% year-over-year, which was a slight uptick from the prior quarter. Still, this year-over-year growth was less than half the typical growth recorded for assisted living before the onset of the pandemic, which was 3.2% annually.
- This slower inventory growth stems from the slowdown in construction starts that we experienced during the height of the pandemic, a trend that occurred for both independent living and assisted living.

Takeaway #4: A Growing Share of Inventory is 25 Years or Older
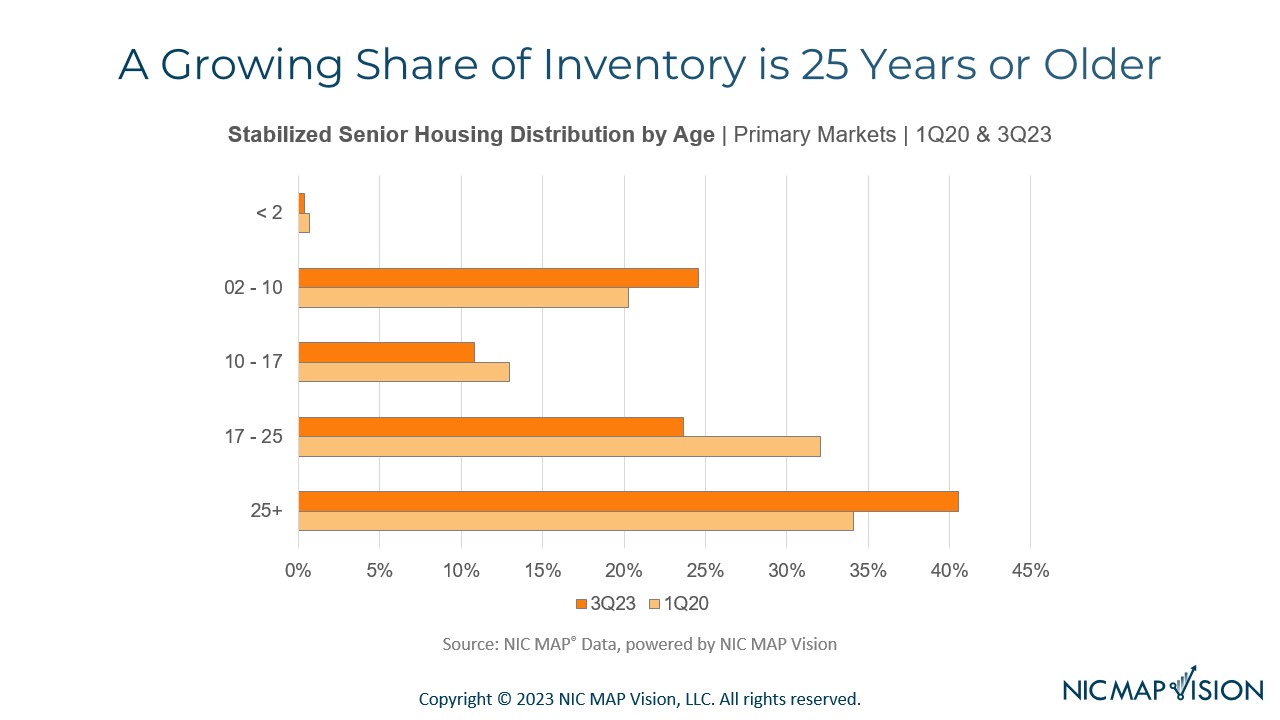
- With inventory growth slowing, it is interesting to evaluate how senior housing inventory has aged in recent years. In the chart below, we illustrate the distribution of stabilized properties in the first quarter of 2020 and the third quarter of 2023.
- As shown at the bottom of the chart, the share of properties that are 25 years or older has grown from 34% to 41% in the past three and a half years. This older cohort has one of the largest shares of properties with occupancies that are 80% or lower, which may be driven by several factors, e.g., older floor plans that no longer meet consumer needs in terms of the size of units or the unit mix.
- Meanwhile, the share of properties that are 10 to 17 years old has shrunk slightly from 13% to less than 11%. This younger cohort has the highest share of occupancy rates at 90% or higher, which could be indicative of having an established team in place and perhaps some brand recognition.

Interested in learning more?
The data featured in this article derives from NIC’s analysis of NIC MAP Vision’s Senior Housing Market Fundamentals Data Release. NIC MAP Vision clients with access to NIC MAP data also receive an exclusive invitation to a market fundamentals webinar led by NIC’s Research team where they review each quarter’s trends in context with historical data and current events. To get a better idea of what’s covered, watch an abridged version of the webinar. To learn more about NIC MAP data, powered by NIC MAP Vision, and accessing the data featured in this article, schedule a meeting with a product expert today.
NIC MAP Vision gives operators, lenders, investors, developers, and owners unparalleled market data for the seniors housing and care sector.
