
NIC MAP Vision Fourth Quarter 2023 Key Takeaways: Senior Housing Occupancy Rate Increases for Tenth Consecutive Quarter
February 5, 2024
The NIC Analytics team presented findings during a webinar with NIC MAP Vision clients on January 18, to review key senior housing data trends during the fourth quarter of 2023.
NIC Analytics, along with the NIC MAP Vision team, implemented a new quarterly webinar format in which the second half features a deep dive on a special topic. In January’s webinar, Larry Graeve from Weitz Construction and Omar Zar, NIC Senior Principal in Research and Analytics, delved into senior housing construction trends. Their presentations were followed by a lively moderated discussion with Lisa McCracken, NIC’s Head of Research & Analytics. NIC hopes NIC MAP Vision clients enjoyed this new webinar format and welcome any comments or suggestions.
Key takeaways from the fourth quarter data included the following:
Takeaway #1: Primary Market Fundamentals on Track for Occupancy Recovery in Second Half of 2024
- The occupancy rate for the 31 NIC MAP Primary Markets rose 0.8 percentage points to 85.1% in the fourth quarter. This marked the tenth consecutive quarter of occupancy gains.
- Occupancy is 7.3 percentage points above its pandemic-related low of 77.8% recorded in mid-2021 and only 1.9 percentage points below its pre-pandemic level of 87.1% in the first quarter of 2020.
- Robust demand coupled with moderate levels of new supply has driven occupancy gains, and at this current pace, senior housing occupancy rates are on track to recover to pre-pandemic levels in the second half of 2024.
Takeaway #2: Secondary Markets’ Occupancy Rate Has Recovered to Pre-pandemic Levels
- For the 68 NIC MAP Secondary Markets, the occupancy rate in 2023 increased by 2.2 percentage points during the fourth quarter to 87.0%, which is 0.2 percentage points more than its pre-pandemic level.
- When breaking out occupancy by property type, the more needs-driven majority assisted living properties have led this recovery, with occupancy 1.2 percentage points above its pre-pandemic level, while the more choice-based majority independent living properties have only 0.9 percentage points left to recover.
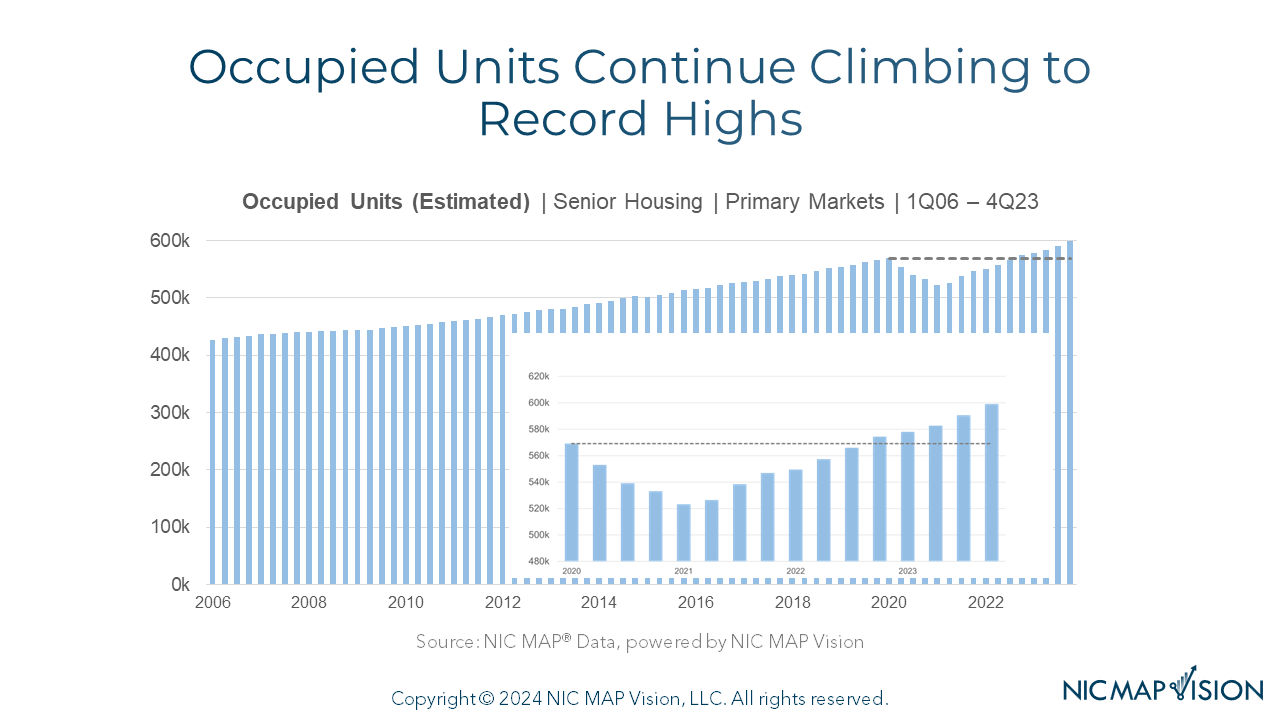
Takeaway #3: Occupied Units Continue Climbing to Record Highs
- The total number of occupied senior housing units for the 31 Primary Markets set another high in the fourth quarter, rising to 598,995 units. This was 29,905 units higher than the pre-pandemic first quarter of 2020 level.
- This trend of record high occupied units is similar for the 68 Secondary Markets as well and shows that today more older adults than even before are residents in senior housing properties, which speaks to the tremendous need for housing and care.
Takeaway #4: Inventory Growth Remains Relatively Moderate
- Inventory growth for the 31 Primary Markets totaled 9,552 units in 2023, down from 11,078 units in 2022.
- Overall, inventory growth has generally trended down from its high point of 21,314 units in 2018 as supply chain issues, labor shortages, and less favorable financing conditions have weighed on new supply.
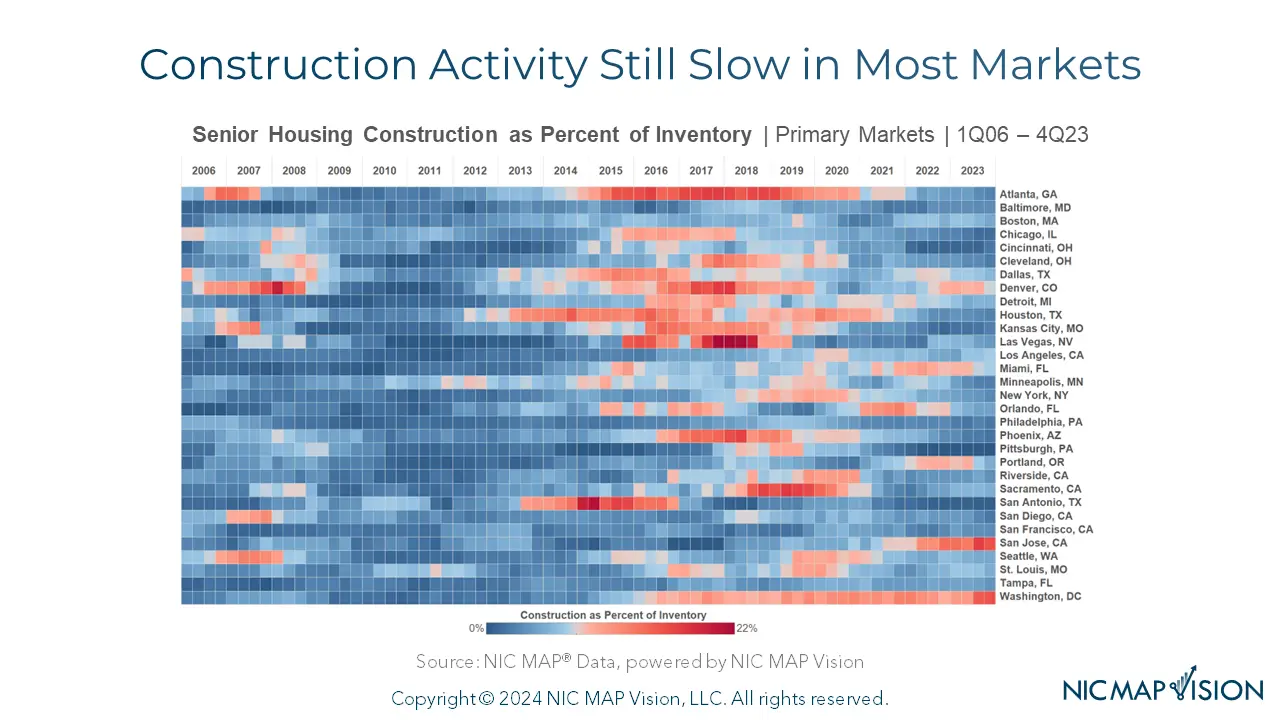
Takeaway #5: Construction Activity Still Slow in Most Markets
- By metropolitan market, this heat map below shows which Primary Markets are experiencing the most construction activity, with blue tones indicating that construction activity is relatively “cool” and red tones indicating markets with the most construction activity.
- Washington, DC and San Jose have the most construction underway each totaling 16% of existing inventory, followed by Denver at 8% and Los Angeles and Miami, which were each at 7%.
Interested in learning more?
The data featured in this article derives from NIC’s analysis of NIC MAP Vision’s Senior Housing Market Fundamentals Data Release. NIC MAP Vision clients with access to NIC MAP data also receive an exclusive invitation to a market fundamentals webinar led by NIC’s Research team where they review each quarter’s trends in context with historical data and current events. To get a better idea of what’s covered, watch an abridged version of the webinar. To learn more about NIC MAP data, powered by NIC MAP Vision, and accessing the data featured in this article, schedule a meeting with a product expert today.
NIC MAP Vision gives operators, lenders, investors, developers, and owners unparalleled market data for the seniors housing and care sector.