
Recovery in Senior Housing Demand Uneven Across Markets and Properties
December 17, 2021
Since the start of the pandemic, senior housing properties have all experienced wide-ranging pandemic-related challenges, but the depth of the demand contraction has differed across markets.
As senior housing demand began to recover in the second quarter of 2021 and registered its strongest increase the following quarter (3Q2021), NIC MAP® data, powered by NIC MAP Vision, shows that certain markets are recovering quickly, while others continue to lag. Due to the skewed pandemic impact the sector has experienced, the demand recovery paths and timelines are proving to be uneven across both markets and properties.
Methodology
-
In this analysis, we examine senior housing demand recovery across the 31 NIC MAP Primary Markets by looking at the share of “same-store” properties where pre-pandemic occupied unit levels have been achieved. Same store is defined as properties that have been open and reporting data at least since 3Q2019, three full quarters before the pandemic began to influence the senior housing sector. Within the 31 NIC MAP Primary Markets aggregate, we identified 4,863 same-store senior housing properties.
-
This analysis is based purely on demand, as defined by changes in net absorption or occupied units and does not take supply conditions within the same-store properties into account. Additionally, closed and newly opened properties since 3Q2019 have been excluded from this analysis.
-
The concept of demand or the number of occupied units is critically important to evaluate senior housing markets’ recovery. Occupancy rates are a broader concept and take into account new supply or newly opened units in the last 18 months, in addition to the upcoming inventory currently under construction.
Senior Housing Demand Recovery
-
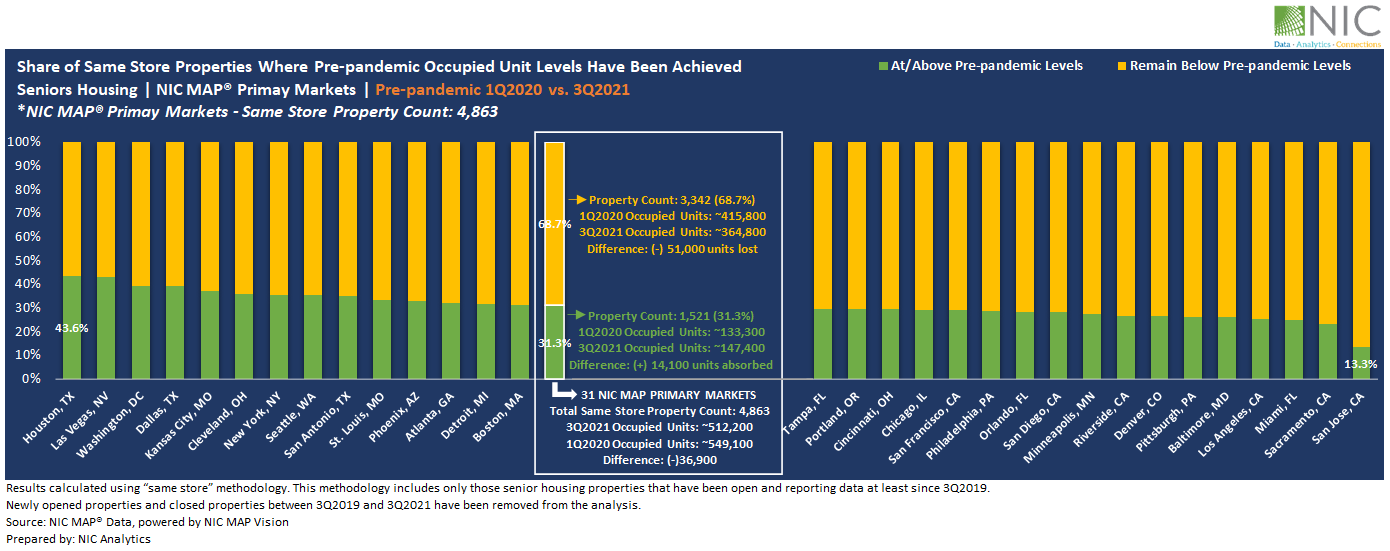
Exhibit 1 below shows that 1Q2020 pre-pandemic occupied unit levels have been achieved or surpassed in nearly one-third (31.3% – equivalent to 1,521 properties) of same-store properties within the NIC MAP Primary Markets aggregate. In fact, occupied units within this cohort grew by about 14,100 units between the first quarter of 2020 and the third quarter of 2021, equivalent to 10.6% of pre-pandemic occupied stock. Further, the occupied stock in this cohort as a share of overall demand within the 4,863 properties identified in this analysis went from 24% in 1Q2020 to 29% in 3Q2021, up five percentage points.
-
By contrast, the number of occupied units within roughly two-thirds of properties (68.7%) in 3Q2021 remained substantially below pre-pandemic 1Q2020 levels, with 51,000 units still placed back in the market, equivalent to 12.3% of pre-pandemic occupied stock. Additionally, the occupied stock in this cohort as a share of overall demand went from 76% in 1Q2020 to 71% in 3Q2021, down five percentage points.
-
The COVID-19 pandemic recovery has been uneven between markets and properties. If we were to graph this recovery, we would get a shape that resembles a “K,” with an increase in the share of occupied stock across properties that have already achieved or surpassed pre-pandemic occupied unit levels, and a decrease in the share of occupied stock across properties where demand remains below pre-pandemic levels.
Market-Specific Demand Recovery
-
Drilling deeper into select metropolitan markets within the NIC MAP Primary Markets, Houston and Las Vegas had the largest share of same store properties where 3Q2021 occupied units have returned to the same level or exceeded 1Q2020 pre-pandemic occupied unit levels at 43.6% and 42.9%, respectively, while San Jose had the smallest share among the 31 Primary Markets at 13.3%. Notably, San Jose is a bit of an anomaly. It is one of the very few markets that has experienced negative inventory growth associated with units being pulled off the market throughout the pandemic, and some of these units were occupied in 1Q2020.
-
Overall, pre-pandemic occupied units across 14 of the 31 Primary Markets have been achieved or surpassed in at least 30% of the same store properties within each market, some of these markets include Washington (39.1%), Dallas (39.1%), Detroit (31.7%), and Boston (31.4%). Other than San Jose, the lowest shares of same-store properties where pre-pandemic occupied units have been achieved or surpassed were seen in Sacramento (23.1%), Miami (24.8%), and Los Angeles (25.0%).
Aggregate Market Demand Growth
-
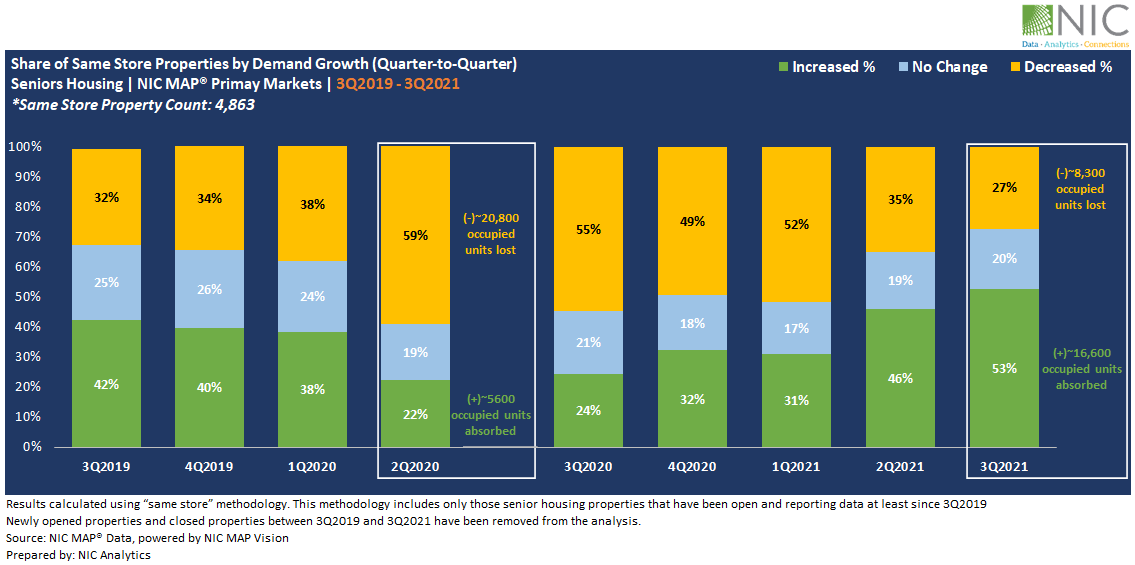
Exhibit 2 below provides another way to look at demand growth, comparing the share of same store properties reporting an increase, decrease, or no change in occupied units (quarter-to-quarter) since 3Q2019. Notably, the market’s initial contraction was identified in the second quarter of 2020, and developed over subsequent quarters, through the first quarter of 2021. As demand improved in the second quarter of 2021, seniors housing properties began to see promising signs of improvement. This has translated to increases in demand within 46% of same store seniors housing properties within the aggregated 31 NIC MAP Primary Markets.
-
In the third quarter of 2021, the share of properties reporting an increase in occupied units rose by six percentage points to 53% as demand improved and registered its strongest increase in the number of occupied units since NIC MAP began reporting the data back in 2005. At the same time, 20% of properties reported no change in the number of occupied units from the second quarter of 2021, and 27% of properties reported a decrease in occupied units over the same period, down eight percentage points from the second quarter of 2021. This was the smallest share recorded throughout the pandemic.
-
While the majority of same store senior housing properties (53%) experienced an increase in demand in the third quarter of 2021, with 16,600 occupied units absorbed in one quarter, demand continued to trend downward across 27% of properties, with 8300 units lost or placed back in the market, half of the units absorbed by those properties reporting an increase in demand.
-
The key takeaway from this analysis is that the path to recovery looks different at the property level and will be influenced by how resilient properties were in 2020 and the first half of 2021. If we look at the second quarter of 2020, while the majority of senior housing properties experienced a dramatic decrease in occupied units (20,800 occupied units lost in one quarter), 22% of properties did relatively better and even experienced an increase in occupied units with 5,600 units absorbed at the height of the pandemic.
As the recovery in senior housing continues and as the industry continues to navigate its way through the pandemic, there are likely to be further twist and turns, and ups and down, but the sector has proven itself to be agile and resilient and will bounce back. That said, and as this analysis has shown, the recovery paths and timelines of demand may differ from one market to another, and from one property to another.
Interested in learning more about NIC MAP® data? To learn more about NIC MAP data, powered by NIC MAP Vision, schedule a meeting with a product expert today.
—-
This blog was originally published on NIC Notes.
About NIC
The National Investment Center for Seniors Housing & Care (NIC), a 501(c)(3) organization, works to enable access and choice by providing data, analytics, and connections that bring together investors and providers. The organization delivers the most trusted, objective, and timely insights and implications derived from its analytics, which benefit from NIC’s affiliation with NIC MAP Vision, the leading provider of comprehensive market data for senior housing and skilled nursing properties. NIC events, which include the industry’s premiere conferences, provide sector stakeholders with opportunities to convene, network, and drive thought-leadership through high-quality educational programming. To see all that NIC offers, visit nic.org.
NIC MAP Vision gives operators, lenders, investors, developers, and owners unparalleled market data for the seniors housing and care sector.