
How Net Absorption Rate Measures Demand in the Senior Housing Market
April 3, 2023
Knowing consumer demand in the senior housing market can help you better understand current market conditions and adjust to changes accordingly. NIC MAP Vision provides important senior housing market data to stakeholders who are researching supply and demand trends in the industry. One of those data is net absorption, which is an important real estate metric used to indicate consumer demand for senior housing. The net absorption rate is described as the net change in occupied units, a comparison of the number of units sold during a given period to the total number of units in the market, and the rate at which available units are sold over a set time frame.
How Absorption Is Used
Senior housing market professionals use absorption to stay informed and make better business decisions, such as:
- Determining housing market influences.
- Indicating when investors and developers should start buying
- Helping brokers decide how to price a unit for sale
- Aiding operators when considering whether to reposition a property
- Gauging whether builders should construct more units now or wait for a better market
- Advising lenders when evaluating loan and credit terms
What’s The Latest Senior Housing Market Data on Net Absorption Rates?
NIC MAP Vision Performance Data provides insights into the market dynamics determined through various time series senior housing market data such as supply and demand indicators, property transactions, financial metrics, and more.
The following tables, maps, and charts from our database give accurate, actionable, and timely information on senior housing from the first quarter of 2020 to the fourth quarter of 2022. This data provides transparency around the impact of the COVID-19 pandemic on senior housing that will help you move forward.
Top and Bottom 10 Senior Housing Markets
The good news is that occupied senior housing stock has increased by at least 5.0% from the start of the pandemic, Q1-2020, in the top quartile (75th percentile) of primary and secondary markets.
A 5.0% increase in occupied senior housing units marks the top quartile or 75th percentile of all Primary and Secondary CBSAs, the top-99 markets nationally.
In total, a little more than half of primary and secondary markets have recovered their lost inventory due to the pandemic, while a little less than half have yet to exceed their pre-pandemic occupied inventory.
From the NIC MAP Vision Database: The table below shows the percentage of change in occupied units by Metropolitan Statistical Area (MSA) from Q1-2020 to Q4-2022.
| Top 10 Markets | % Change in Occupied Units from Start of Pandemic | Bottom 10 Markets | % Change in Occupied Units from Start of Pandemic |
| Bridgeport, CT | 18.6% | San Francisco, CA | -4.5% |
| Austin, TX | 13.1% | Scranton, PA | -4.8% |
| Charleston, SC | 10.8% | Memphis, TN | -6.7% |
| Columbia, SC | 9.4% | Albuquerque, NM | -6.8% |
| Colorado Springs, CO | 9.1% | Buffalo, NY | -7.6% |
| Salt Lake City, UT | 8.7% | Providence, RI | -8.6% |
| Atlanta, GA | 8.3% | Akron, OH | -9.0% |
| Raleigh, NC | 8.2% | Youngstown, OH | -9.2% |
| Indianapolis, IN | 8.2% | Stockton, CA | -11.1% |
| Ogden, UT | 8.1% | El Paso, TX | -20.3% |
The above data was calculated via the CBSA Trends report available to NIC MAP Vision clients within the platform. Occupied unit trends by various property types across all NIC MAP coverage markets are included.
Senior Housing: Net Absorption Gain
NIC MAP Vision Market Performance Data: Map 1 shows the occupied unit change from Q1-2020, the pre-pandemic benchmark, to Q4-2022, the current quarter across the NIC MAP Primary and Secondary markets.
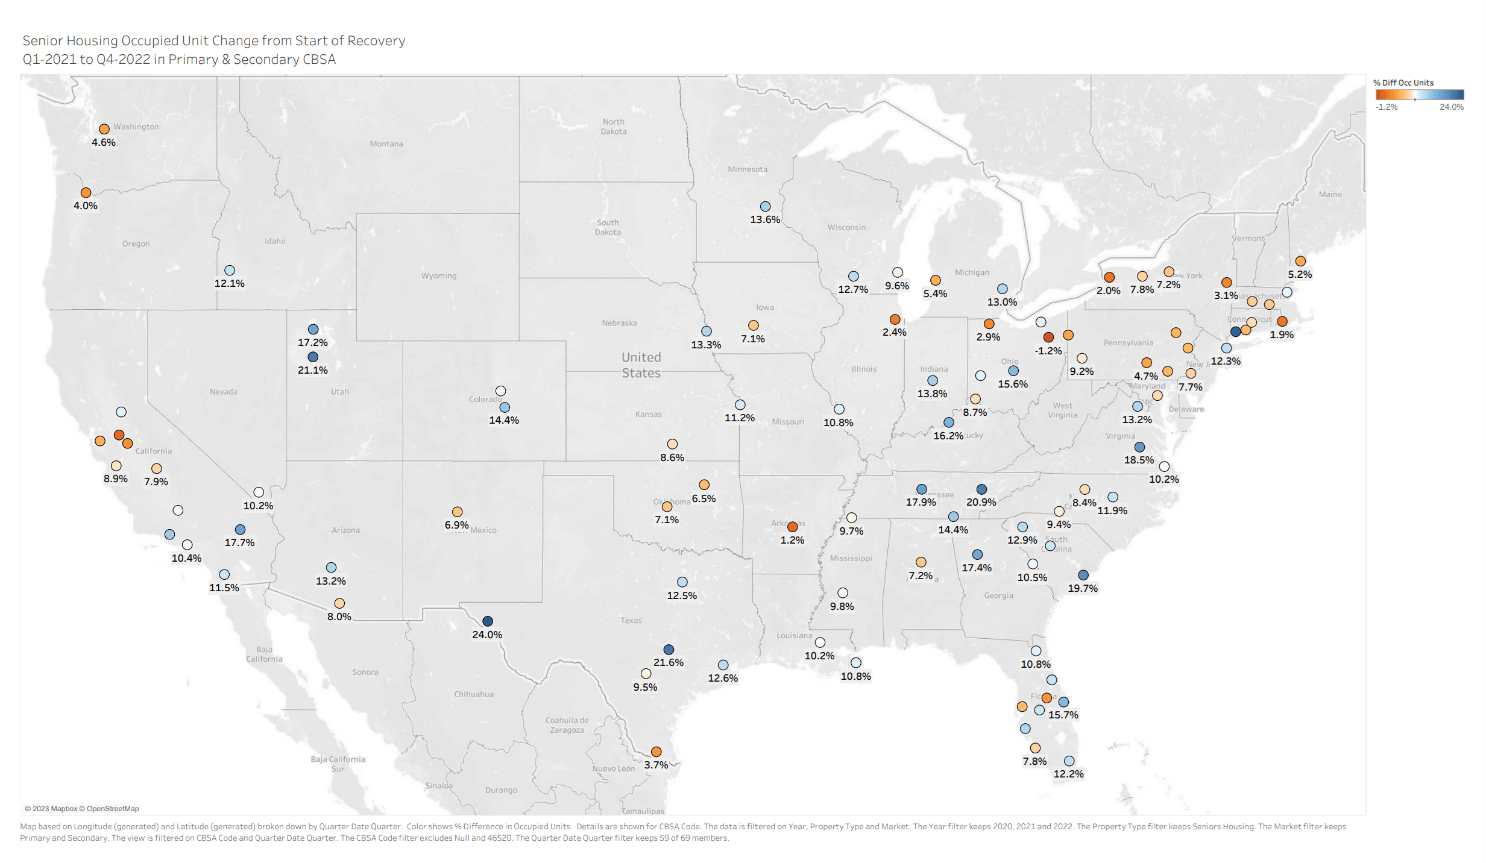
- Markets throughout the south including in Texas, Florida, Arizona, and Georgia have gained back lost inventory from 2020 and significantly increased the volume of occupied inventory in 2022.
- Markets in states such as Illinois, Pennsylvania, California, Oregon, and Washington have made nominal absorption gains in 2021 and 2022 but have yet to exceed their absorption losses from 2020.
NIC MAP Vision Market Performance Data: The chart below shows the markets (MSA) percent change from Q1-2020 to Q4-2022 in occupied units on the x-axis and the markets (MSA) percent change from its lowest occupied inventory quarter to the current quarter on the y-axis in primary markets.

- Markets such as Chicago, San Francisco, Tampa, Orlando, Portland, and Seattle have yet to return to the senior housing occupied stock they experienced prior to the pandemic as these markets have only increased between 3.5% to 6.5% since their occupied unit bottom in mid-2021.
- By contrast, markets such as Atlanta, Minneapolis, Phoenix, and Washington DC are up at least 5.8% in senior housing occupied stock compared to its pre-pandemic benchmark and are up at least 13.2% from their pandemic bottom.
- For reference, the primary market average for occupied units is up 1.2% from its pre-pandemic benchmark in the first quarter of 2020 and is up 10.0% from its pandemic bottom in Q1-2021.
After reviewing this analysis from the NIC MAP Vision database, you can see that strong absorption does not necessarily mean high market occupancy. For example, senior housing occupied units have increased by 8.3% in the Atlanta metro area since Q1-2020 but Atlanta is at 79.0% occupied. By comparison, the Baltimore metro is still down 2.5% from its pre-pandemic benchmark in occupied units but the current senior housing occupancy rate in Baltimore is 86.7%.
Interested In Learning More?
Now more than ever, the actionable data provided by NIC MAP Vision can help you stay informed. Trusted by 5,000+ customers and built exclusively for the seniors housing and care sector, NIC MAP Vision provides comprehensive nationwide supply & demand metrics on 35K+ properties, with over 15 years of comprehensive, time-series market data at the metro level.
If you want clarity and transparency to understand the dynamics of the senior housing market, talk with a product expert today to learn more about how our rate and occupancy data can help support your business and save you time in an increasingly competitive market.
NIC MAP Vision gives operators, lenders, investors, developers, and owners unparalleled market data for the seniors housing and care sector.