
Senior Housing Units Vacated During Pandemic Near Full Recovery on Net Basis
October 6, 2022
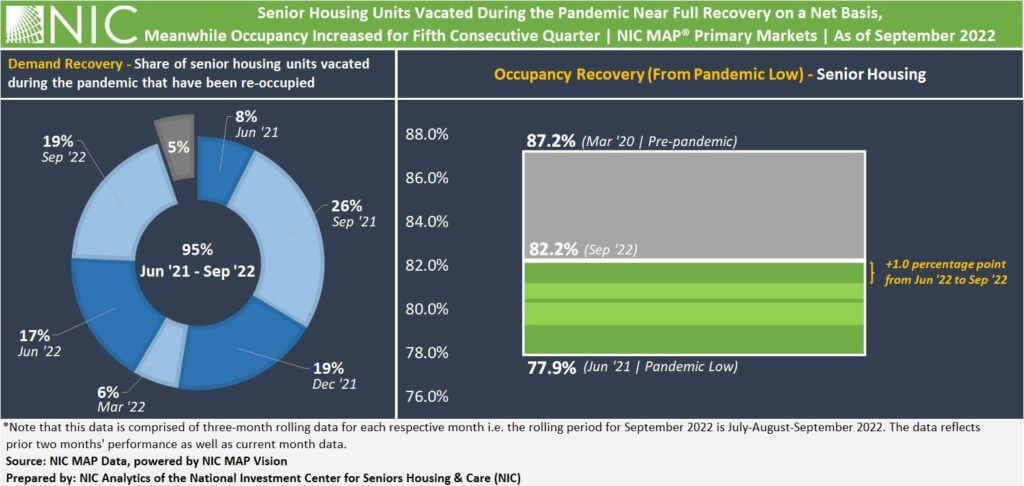
According to quarterly NIC MAP® data, released by NIC MAP Vision, demand, as measured by the change in occupied units, largely outpaced new supply while marking its sixth consecutive quarter of positive increases, with a net absorption gain from the prior quarter of more than 8,700 units, or 1.6% for the NIC MAP Primary Markets. This advance pushed the share of senior housing units vacated during the pandemic that have been re-occupied to near-full recovery (95%). If this pace of demand growth continues into the next quarter, senior housing may soon start filling new inventory added during the pandemic, on a net basis.
As a result of supply/demand trends, the exhibit below shows that the all-occupancy rate for senior housing for the NIC MAP Primary Markets increased for the fifth consecutive quarter to 82.2% in the September 2022 reporting period, up 1.0 full percentage point (pps) from the June 2022 reporting period on a three-month rolling basis, with a small gain of 0.1pps from August 2022. From its time series low of 77.9% in June 2021, occupancy increased by 4.3pps but remained 5.0pps below pre-pandemic March 2020 levels of 87.2%.
By: Omar Zahraoui | October 06, 2022
Senior Housing Units Vacated During Pandemic Near Full Recovery on Net Basis
BUSINESS ENVIRONMENT | MARKET TRENDS | NIC MAP VISION | SENIOR HOUSING
According to quarterly NIC MAP® data, released by NIC MAP Vision, demand, as measured by the change in occupied units, largely outpaced new supply while marking its sixth consecutive quarter of positive increases, with a net absorption gain from the prior quarter of more than 8,700 units, or 1.6% for the NIC MAP Primary Markets. This advance pushed the share of senior housing units vacated during the pandemic that have been re-occupied to near-full recovery (95%). If this pace of demand growth continues into the next quarter, senior housing may soon start filling new inventory added during the pandemic, on a net basis.
As a result of supply/demand trends, the exhibit below shows that the all-occupancy rate for senior housing for the NIC MAP Primary Markets increased for the fifth consecutive quarter to 82.2% in the September 2022 reporting period, up 1.0 full percentage point (pps) from the June 2022 reporting period on a three-month rolling basis, with a small gain of 0.1pps from August 2022. From its time series low of 77.9% in June 2021, occupancy increased by 4.3pps but remained 5.0pps below pre-pandemic March 2020 levels of 87.2%.
Exhibit
By Majority Property Type. At 84.7%, the all-occupancy rate for majority independent living (IL) properties for the NIC MAP Primary Markets increased 0.9pps from June 2022, with a gain of 0.2pps from August 2022. For majority assisted living properties (AL), the all-occupancy rate for the NIC MAP Primary Markets remained unchanged from August 2022 but was up 1.1pps to 79.7% from June 2022. Occupancy for both independent living properties and assisted living properties remained 4.9pps below March 2020 levels.
All-occupancy increased or remained stable in 27 of the 31 Primary Markets for IL in the September 2022 reporting period compared with June 2022. At 82.2%, Miami saw the largest quarterly improvement in September 2022, up 2.4pps from June 2022. Orlando IL occupancy fell 1.6pps in September 2022 to 84.5%. Orlando had the largest quarterly decline among the 31 NIC MAP Primary Markets.
All-occupancy rose or remained stable in 29 of the 31 Primary Markets for AL in September 2022 compared with June 2022. At 78.4%, Phoenix occupancy saw the largest increase since June 2022 and gained 2.8pps quarter-to-quarter. Seattle’s occupancy remained unchanged from August 2022 but fell by 1.4pps from June 2022 to 77.5%. Seattle had the largest quarterly decline among the 31 NIC MAP Primary Markets.
Keep track of the most timely comprehensive review of the sector’s market fundamentals and trends. The NIC Intra-Quarterly Snapshot monthly publication, available for complimentary download on our website, continues to provide a powerful and closely watched means to stay ahead of industry trends, even as senior housing markets sustain a fast pace of evolution and adaptation, amidst an apparent recovery.
The October 2022 IQ Snapshot report will be released on nic.org on Thursday, November 10, 2022, at 5:00pm.
Interested in learning more about NIC MAP Intra-Quarterly data? To learn more about NIC MAP Vision data, schedule a meeting with a product expert today.
—-
This blog was originally published on NIC Notes.
About NIC
The National Investment Center for Seniors Housing & Care (NIC), a 501(c)(3) organization, works to enable access and choice by providing data, analytics, and connections that bring together investors and providers. The organization delivers the most trusted, objective, and timely insights and implications derived from its analytics, which benefit from NIC’s affiliation with NIC MAP Vision, the leading provider of comprehensive market data for senior housing and skilled nursing properties. NIC events, which include the industry’s premiere conferences, provide sector stakeholders with opportunities to convene, network, and drive thought-leadership through high-quality educational programming. To see all that NIC offers, visit nic.org.
NIC MAP Vision gives operators, lenders, investors, developers, and owners unparalleled market data for the seniors housing and care sector.