
Near-Record High Demand for Senior Housing and Other Key Takeaways from NIC MAP Fourth Quarter 2021 Senior Housing Data Release Webinar
January 26, 2022
NIC MAP Vision clients, with access to NIC MAP® data, attended a webinar in mid-January on key seniors housing data trends during the fourth quarter of 2021. Findings were presented by the NIC Analytics research team. Key takeaways included the following:
Takeaway #1: Senior Housing Occupancy Up 2.3 Percentage Points from Pandemic Low
-
Occupancy jumped one full percentage point to 81.0% in the fourth quarter due to favorable supply and demand conditions. From its low point of 78.7% in the first and second quarters of 2021, it is up 2.3 percentage points. However, it remains 6.4 percentage points below its pre-pandemic level of 87.4%.
-
For seniors housing, inventory growth continued to slow to only 2,910 units in the fourth quarter. This was the fewest units added to inventory since the first quarter of 2019. For further perspective, its pre-pandemic 10-year quarterly average was 3,333 units per quarter.
-
Inventory growth has generally trended down from its high point of 6,100 units in mid-2019. It’s likely to continue to do so due in the near term to a slowdown in starts in 2020 and early 2021.
Takeaway #2: Record High Demand Occurred in Second Half of 2021
-
The second half of 2021 will be remembered as a time of rebounding demand as it registered the strongest unit improvement of net positive absorption, as measured by the change in occupied stock, since NIC MAP began reporting the data in 2005.
-
More specifically, demand continued to strengthen in the fourth quarter, albeit at a slower pace than in the record-setting third quarter. Indeed, net absorption continued to recover in the fourth quarter of 2021, increasing by 9,035 units in the Primary Markets, the 2nd strongest unit increase since NIC MAP Vision began reporting the data in 2005. In the third quarter, net absorption totaled 11,994 units. For both quarters, this equaled 21,029 units. Combined with the second quarter (3,401 units), net absorption increased by 24,430 units in the last nine months of 2021
-
Notably, this is a clear reversal in trend from the loss of 42,129 units during the pandemic in the second, third and fourth quarters of 2020 and the first quarter of 2021.
Takeaway #3: Very Large Chains Saw Most Increase in Occupancy Rates in Fourth Quarter
-
Very large chains (operators with 25 properties or more), have consistently had lower occupancy rates than other chain groupings. Very large chains also incurred the largest occupancy drop related to the pandemic—down 10.1 percentage points. But they have also seen the largest improvement in occupancy since hitting bottom in the first quarter. In the fourth quarter, the occupancy rate for very large chains was 78.4%, a 3.3 percentage point improvement from its nadir of 75.1% in the first quarter of 2021.
-
Large chains (10 – 24 properties) had the second-best improvement in occupancy rising from 80.3% at its pandemic-related low in the first quarter to 83.2% at year end, a gain of 2.9 percentage points. Moreover, large chains had the highest fourth quarter occupancy of any of the groupings.
-
Single properties were not far behind, however, at 83.0%.
Takeaway #4: Occupancy Distribution Varies by Market
-
The average occupancy rate for seniors housing in the 31 Primary Markets was 80.1% in the fourth quarter while the median occupancy was 84.6%. This large difference means that the range of occupancy rates by individual properties is broad and the distribution wide.
-
In the fourth quarter, 14.7% of the Primary Markets properties had occupancy rates above 95% and another 18.4% had occupancy rates between 90 and 95%. But by market, this varies considerably.
-
Conversely, 39.2% of properties in the database had occupancy rates below 80%. This is better than 41.8% in the third quarter, but well above the 22.3% pre-pandemic. This cohort includes those properties that opened during a global pandemic and those properties that have slipped in occupancy during this period. This suggests that there are still many operators dealing with properties that have very challenged occupancy rates.
-
The markets with the lowest overall occupancy rates—Houston, Cleveland, and Atlanta—not surprisingly have more than 45% of their properties with occupancy rates below 80% (Houston has 51.1%) and much smaller shares with occupancies above 90%. Some of this occupancy performance may be due to a higher share of newly opened properties in some markets more than in others.
-
San Jose, San Francisco, and Boston in contrast easily have more than one-third of their properties with occupancy rates above 90%, with Boston having 43% of its properties. Atlanta, by contrast, has 22%.

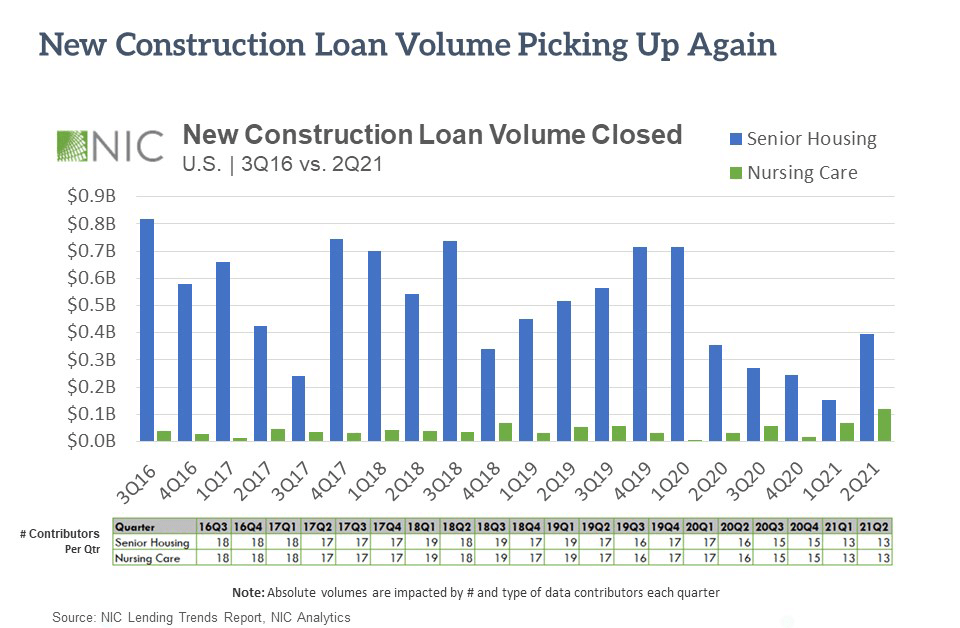
Key Takeaway #5: New Construction Loan Volume Picking Up Again
-
This chart looks at closed construction loan volumes from 2016 through the second quarter of 2021 and is based on NIC’s Lending Trends Report. The full report can be found on our website.
-
The chart mimics the pickup in starts activity that began last year since capital is a requirement and prerequisite for breaking ground on new projects.
-
Indeed, on a four-quarter moving sum basis, starts have turned the corner and are picking up once again after having been on the decline in the immediate aftermath of the pandemic in 2020.
-
For independent living, starts totaled 8,204 units, on a four-quarter sum basis, the most since mid- 2020. For assisted living, there were 9,648 units started on a four-quarter aggregate basis in the fourth quarter, equating to 2.9% as a share of inventory. For perspective, at its peak in early 2016, it was 6.0%.
-
Third quarter data on lending trends will be out in mid-February.
Interested in learning more?
-
While the full key takeaways presentation is only available to NIC MAP clients with access to NIC MAP data, you can access the abridged version of the 4Q21 Data Release Webinar & Discussion featuring my exclusive commentary below.
-
View the Abridged Slides Presentation
-
To learn more about NIC MAP data, powered by NIC MAP Vision, an affiliate of NIC, and accessing the data featured in this article, schedule a meeting with a product expert today.
—-
This blog was originally published on NIC Notes.
About NIC
The National Investment Center for Seniors Housing & Care (NIC), a 501(c)(3) organization, works to enable access and choice by providing data, analytics, and connections that bring together investors and providers. The organization delivers the most trusted, objective, and timely insights and implications derived from its analytics, which benefit from NIC’s affiliation with NIC MAP Vision, the leading provider of comprehensive market data for senior housing and skilled nursing properties. NIC events, which include the industry’s premiere conferences, provide sector stakeholders with opportunities to convene, network, and drive thought-leadership through high-quality educational programming. To see all that NIC offers, visit nic.org.
NIC MAP Vision gives operators, lenders, investors, developers, and owners unparalleled market data for the seniors housing and care sector.