
Seniors Housing Occupancy Shows Nascent Signs of Improvement at the Property Level
July 30, 2021
The recently released NIC MAP® Data, powered by NIC MAP Vision, show that the seniors housing occupancy rate remained unchanged for the aggregated 31 NIC MAP Primary Markets in the second quarter of 2021. However, a recent analysis by NIC Analytics digs further and finds a substantial rise in the share of properties with increasing occupancy rates in 2Q2021.
Notably, 47.1% of seniors housing properties within the NIC MAP Primary markets reported an increase in occupancy rates in 2Q2021 compared with 1Q2021, a relatively higher proportion compared with levels seen during the pandemic and the most since 2Q2019 (pre-pandemic levels). This shows that positive demand is returning, consumer confidence is building, and suggests that the outlook for seniors housing occupancy remains optimistic.
In this blog, we examine occupancy change at the most granular level within the NIC MAP Primary Markets aggregate and across select metropolitan markets to assess seniors housing properties’ performance and occupancy growth.
Top Findings:
-
In 4Q2020 and 1Q2021, about one-third of seniors housing properties within the 31 Primary Markets reported an increase in occupancy rates. This shows that these properties have been able to attract new residents and have been generally resilient.
-
A bit more than 47% of seniors housing properties within the NIC MAP Primary markets reported an increase in occupancy rates in 2Q2021, a relatively higher share compared with levels seen during the pandemic and the most since 2Q2019 (pre-pandemic levels).
-
Of the 31 Primary Markets, all but one saw improvements in the share of properties reporting an increase in occupancy rates in 2Q2021. Nonetheless, new inventory and dispersion in demand growth between properties continued to put downward pressure on occupancy rates across eight of the 31 Primary Markets.
-
Both inventory and the total number of occupied units for the NIC MAP Primary Markets grew by about 0.7% from 1Q2021 levels leaving the seniors housing occupancy rate for the NIC MAP Primary Markets unchanged at 78.7%. However, many individual properties experienced improved occupancy.
-
Occupancy improvement will be shaped by local patterns of inventory growth and demand, and will be influenced by the broad economy, consumer confidence, ease of development, the pandemic and vaccination rates.
-
The 68 NIC MAP Secondary Markets share of properties reporting improvements in occupancy rates increased substantially and was 50.8% in 2Q2021.
-
Detroit and Atlanta had the largest share of properties reporting an increase in occupancy rates at about 55% in the second quarter of 2021, while Baltimore had one of the smallest shares at 34.8%.
-
San Jose had a noteworthy improvement in the share of properties reporting increasing occupancy rates at 46.9% in 2Q2021, but occupancy remains very low by historic standards.
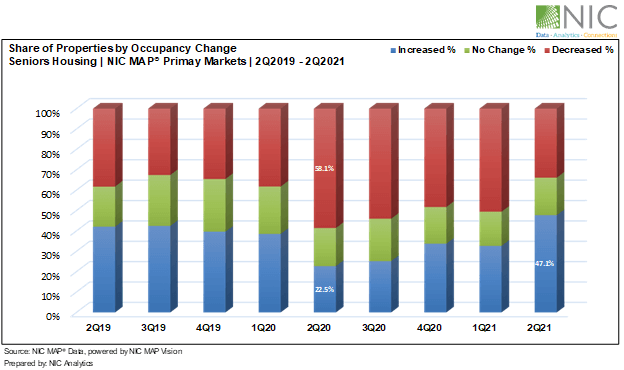
Following the onset of the pandemic in March 2020, the share of seniors housing properties reporting an increase in occupancy rates was 22.5% in 2Q2020, down from 38% in the pre-covid 1Q2020 and the lowest share since NIC began reporting data in 2005. On the other hand, 58.1% of properties reported a decrease in occupancy, the highest share since NIC began reporting data.
As the pandemic continued to evolve, the share of properties reporting an increase in occupancy rates began to gradually improve in 3Q2020 and 4Q2020. Conversely, the share of properties reporting a decrease in occupancy began to gradually decrease over the same period. In fact, based on this occupancy measure, about one-third of seniors housing properties within the 31 Primary Markets have been “pandemic-resilient” in the fourth quarter of 2020 and the first quarter of 2021.
Aggregate Market Performance. Exhibit 1 below shows that seniors housing properties began to see promising signs of rebound in 2Q2021. This has translated to improvements in occupancy rates within 47.1% of seniors housing properties within the aggregated 31 NIC MAP Primary Markets average and across twenty of the 31 Primary Markets.
Notably, the share of properties reporting an increase in occupancy rate improved across 30 of the 31 Primary Markets in the second quarter of 2021, although aggregated occupancy for seniors housing in the Primary Markets was unchanged at 78.7%. This is largely due to new inventory and dispersion in demand growth between properties. Both inventory and the total number of occupied units for the 31 Primary Markets grew by about 0.7% from 1Q2021 levels.
At the market level, 8 of the 31 Primary Markets saw continued downward pressure on occupancy rates. New inventory is an important factor driving occupancy growth. As positive demand continues to build momentum and net absorptions exceeds inventory growth, the NIC MAP Primary Markets aggregate should begin to see an improvement in occupancy, but the recovery is likely to vary by market according to variations in local supply and demand conditions.
Exhibit 1 – Share of seniors housing properties by occupancy change within the NIC MAP Primary Markets.
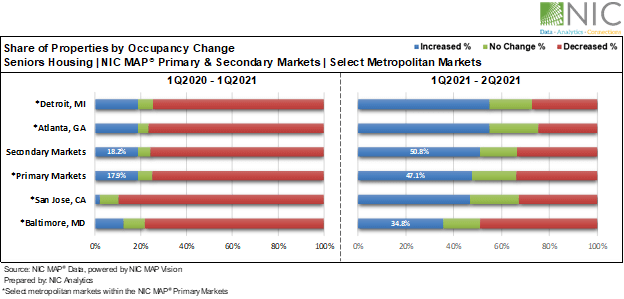
Market-Specific Performance. From 1Q2020 to 1Q2021, about 18% of properties within the 31 Primary Markets and 18% of properties within the 68 Secondary Markets aggregates reported an increase in occupancy rates. In 2Q2021, the shares of properties reporting improvements in occupancy rates from 1Q2021 for the 31 Primary Markets and 68 Secondary Markets increased substantially and was 47.1% and 50.8%, respectively.
Drilling deeper into select metropolitan markets within the NIC MAP Primary Markets, Detroit and Atlanta had the largest share of properties reporting an increase in occupancy rates at about 55% in the second quarter of 2021, while Baltimore had one of the smallest shares at 34.8%. In fact, occupancy in Baltimore continued to slip further from 81.1% in 1Q2021 to 79.6% in 2Q2021. The occupancy drop in Baltimore was largely due to negative absorption.
Interestingly, San Jose, one of the hardest-hit markets during the pandemic, had a noteworthy improvement in the share of properties reporting increasing occupancy rates in 2Q2021. The average occupancy rate in San Jose improved by 0.4pps from 83.3% in 1Q2021 to 83.7% in 2Q2021 but remains 11.1pps below March 2020 levels and very low by historic standards. The slight improvement in occupancy rates in San Jose was mainly driven by negative inventory growth associated with units being pulled off the market.
Exhibit 2 – Share of seniors housing properties by occupancy change within the NIC MAP aggregates and select metropolitan markets.
The path of future occupancy patterns is going to be shaped by supply-demand balances, and the full recovery depends on the course of the pandemic, vaccination rates, economic growth, ease of development and a restoration of consumer confidence.
To learn more about which of the NIC MAP Primary Markets performed better at the property level during the pandemic and to learn more about NIC MAP Data, powered by NIC MAP Vision, and the additional underlying data only available to NIC MAP clients, schedule a meeting with a product expert today.
—-
This blog was originally published on NIC Notes.
About NIC
The National Investment Center for Seniors Housing & Care (NIC), a 501(c)(3) organization, works to enable access and choice by providing data, analytics, and connections that bring together investors and providers. The organization delivers the most trusted, objective, and timely insights and implications derived from its analytics, which benefit from NIC’s affiliation with NIC MAP Vision, the leading provider of comprehensive market data for senior housing and skilled nursing properties. NIC events, which include the industry’s premiere conferences, provide sector stakeholders with opportunities to convene, network, and drive thought-leadership through high-quality educational programming. To see all that NIC offers, visit nic.org.
NIC MAP Vision gives operators, lenders, investors, developers, and owners unparalleled market data for the seniors housing and care sector.