
Skilled Nursing – Keeping the Occupancy Recovery on Track
June 6, 2022
A recent NIC Notes blog titled “Market Fundamentals Amid Challenging Time for Skilled Nursing” published by NIC Analytics, evaluated supply and demand dynamics for freestanding skilled nursing properties within the 31 NIC MAP Primary Markets (Primary Markets) aggregate since 2017, and examined property-level occupancy distribution to get a better understanding of how widespread the effects of the pandemic have been.
This analysis digs further and reviews how select individual skilled nursing markets are faring after two years of the pandemic.
Occupancy Loss and Recovery Varied by Market. During the height of the pandemic, the occupancy loss for freestanding skilled nursing properties across all the Primary Markets was mainly a function of a demand contraction. In fact, inventory across most of the Primary Markets remained somewhat stable over the period from 1Q 2020 to 1Q 2021.
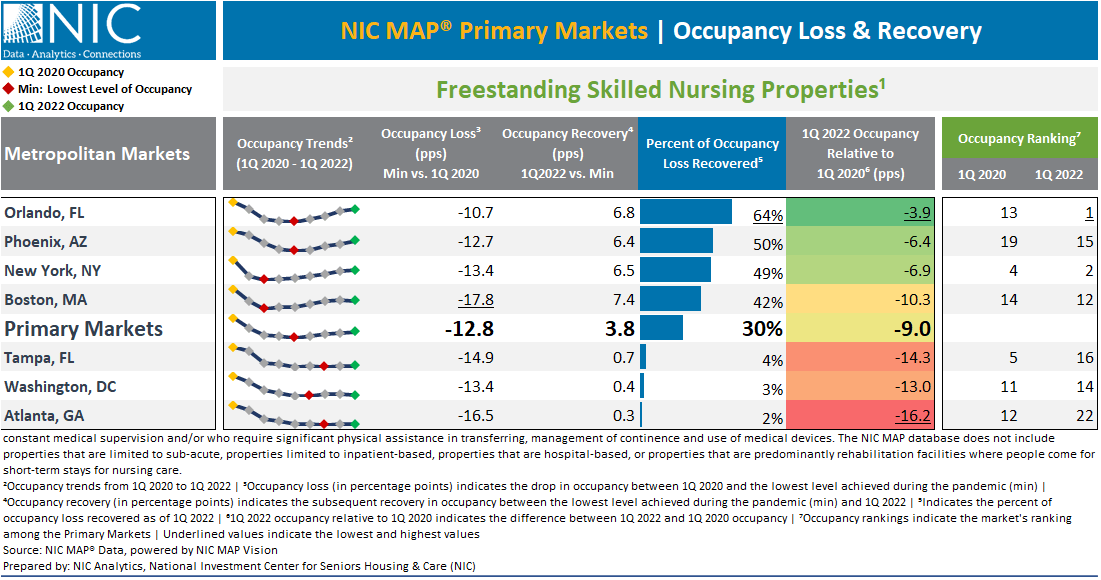
Drilling down into metropolitan markets, Boston’s occupancy fell 17.8 percentage points (pps) from 88.7% in first quarter 2020 to 70.9% in third quarter 2020. As a result, occupied units in Boston fell by nearly 21% in the span of two quarters. This was the largest demand contraction and occupancy loss a market experienced in the first two quarters of the pandemic. New York also experienced a large drop in occupancy. In the early months of the pandemic, New York’s occupancy rate fell 13.4pps from 92.0% in the first quarter of 2020 to 78.6% in the third quarter of 2020.
Notably, all the Primary Markets experienced double-digit occupancy declines, except Dallas (negative 9.6pps) and Kansas City (negative 7.7pps). Additionally, none of the skilled nursing Primary Markets experienced significant inventory growth during the height of the pandemic. Therefore, the skilled nursing occupancy declines were mainly a function of demand contraction whereas the occupancy loss for the private pay senior housing sector was a function of both an increase in supply and a decrease in demand.
On the other hand, the occupancy recovery paths and timelines are also proving to be uneven across markets with select Primary Markets improving more rapidly than others. For example, Orlando is a market that experienced a relatively smaller drop in occupancy during the first year of the pandemic of 10.7pps, from 89.7% in the first quarter of 2020 to 79.0% in the first quarter of 2021. However, Orlando’s occupancy increased by 6.8pps during the second year of the pandemic and stood at 85.9% in the first quarter of 2022. This helped the market recover 64% of the occupancy loss in percentage points and pushed its occupancy ranking from thirteenth to first among the Primary Markets.
The exhibit below shows that occupancy across several markets is recovering relatively fast. These markets include Orlando, Phoenix, New York, and Boston. Notably, 17 of the 31 Primary Markets have recovered at least 30% of the occupancy loss in percentage points, although occupancy across some of these markets is still far below pre-pandemic levels.
While the occupancy improvements across most Primary Markets depict a very welcome positive trend and indicate light on the horizon, the uncertainty bands remain wide in terms of when occupancy rates for skilled nursing properties will return to pre-pandemic levels. A key question is whether obtaining a sustainable level of occupancy and revenue growth will be sufficient to grow NOI and recoup some of the losses associated with the severe downturn in occupancy rates, higher expenses associated with agency staffing, PPE and other costs, Medicare funding cuts, and underfunding of Medicaid reimbursement in many states. Other headwinds for NOI growth include staffing shortages that are effectively restricting admissions of residents into some skilled nursing properties, and broader inflationary effects associated with the pandemic.
For example, a few markets experienced prolonged occupancy pullbacks and the recovery has thus far been elusive. This is the case of Tampa where 1Q 2022 occupancy remained 14.3pps below pre-pandemic 1Q 2020 levels and shifted the market’s ranking among the Primary Markets from fifth to sixteenth. Similarly, Washington and Atlanta are markets that experienced prolonged occupancy declines and remained far below pre-pandemic levels.
We cannot yet know how pandemic-derived challenges will unfold in future months, or when they will be fully behind us, but the skilled nursing industry has weathered this extremely difficult period and begun the path to recovery.
This analysis examined approximately 4,000 freestanding skilled nursing properties within the Primary Markets. Note that combined properties offering at least two types of service and life plan communities (LPCs)/continuing care retirement communities (CCRCs) were excluded from this analysis.
To learn more about NIC MAP data, powered by NIC MAP Vision, an affiliate of NIC, and accessing the data featured in this article, schedule a meeting with a product expert today.
—-
This blog was originally published on NIC Notes.
About NIC
The National Investment Center for Seniors Housing & Care (NIC), a 501(c)(3) organization, works to enable access and choice by providing data, analytics, and connections that bring together investors and providers. The organization delivers the most trusted, objective, and timely insights and implications derived from its analytics, which benefit from NIC’s affiliation with NIC MAP Vision, the leading provider of comprehensive market data for senior housing and skilled nursing properties. NIC events, which include the industry’s premiere conferences, provide sector stakeholders with opportunities to convene, network, and drive thought-leadership through high-quality educational programming. To see all that NIC offers, visit nic.org.
NIC MAP Vision gives operators, lenders, investors, developers, and owners unparalleled market data for the seniors housing and care sector.