
Skilled Nursing Occupancy Increased to 74.2% in June 2021
September 8, 2021
Reimbursement differential between Medicare fee-for-service and managed Medicare has accelerated during the pandemic.
NIC MAP® Data Service, powered by NIC MAP Vision, released its latest Skilled Nursing Monthly Report on September 2, 2021, which includes key monthly data points from January 2012 through June 2021.
Here are some key takeaways in collaboration with NIC Analytics regarding the data covered in the report:
The upward trend in skilled nursing occupancy continued in June. Occupancy increased for the fifth month in a row, rising 86 basis points from May to end June at 74.2%. Occupancy is now up 297 basis points from the 71.2% low point reached in January. There continues to be optimism, especially from investors, given the success of the vaccines but the second half of 2021 will be crucial in terms of the occupancy trend. The expectation is that admissions will continue to increase with rising demand and elective surgeries will continue to provide support for additional admissions to skilled nursing properties. However, occupancy still is very low relative to pre-pandemic levels and cash flow and liquidity is a concern at some properties. Occupancy is down 11.2 percentage points from the pre-pandemic February 2020 level of 85.4%. In addition, the Delta variant does pose a threat, especially in some states with lower vaccinated populations.

Managed Medicare revenue per patient day (RPPD) held steady in June but is down 4.2% from last year in June 2020. The continued decline in managed Medicare revenue per patient day poses a challenge to skilled nursing operators as the reimbursement differential between Medicare fee-for-service and managed Medicare has accelerated during the pandemic. Medicare fee-for-service RPPD ended June 2021 at $560 and managed Medicare ended at $453, representing a $107 differential. Pre-pandemic, in February of 2020, the differential was $92. As managed Medicare continues to grow, operators and investors should pay attention to this trend and adjust accordingly.
Medicare revenue mix and RPPD continue to decline as fewer COVID-19 cases in properties have resulted in less need for utilizing the 3-Day rule waiver and per day reimbursement for COVD-19-positive patients. Medicare revenue mix ended June at 20.0% and is down from its pandemic high of 24.8% set in January 2021. Medicare RPPD is down 2.5% from its pandemic peak of $574 in June 2020. Meanwhile, managed Medicare revenue mix was essentially flat at 10.5%. However, this is 240 basis points above the pandemic low of 8.1% set in May 2020.
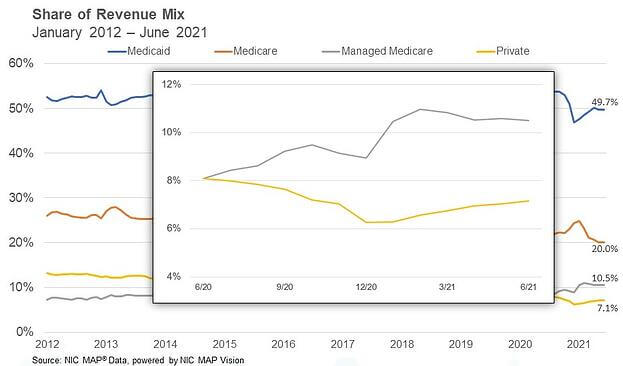
Medicaid patient day mix continued to increase, albeit slowly, ending June at 66.5%. It has increased 292 basis points from the pandemic low of 63.6% set in January 2021. Meanwhile, Medicaid revenue mix was flat from the prior month, ending June at 49.7%. One element of the Medicaid revenue share of a property’s revenue is RPPD and that has declined 1.4% since the pandemic high of $243 set in February 2021. RPPD has likely declined due to less reimbursement support from most states as COVID-19 cases within skilled nursing properties declined.
To get more trends from the latest data you can download the Skilled Nursing Monthly Report here. There is no charge for this report.
The report provides aggregate data at the national level from a sampling of skilled nursing operators with multiple properties in the United States. NIC continues to grow its database of participating operators in order to provide data at localized levels in the future. Operators who are interested in participating can complete a participation form at https://www.nic.org/skilled-nursing-data-initiative. NIC and NIC MAP Vision maintain strict confidentiality of all data received.
Interested in learning more about NIC MAP data? To learn more about NIC MAP data, powered by NIC MAP Vision, and about accessing the data featured in this article, schedule a meeting with a product expert today.
—-
This blog was originally published on NIC Notes.
About NIC
The National Investment Center for Seniors Housing & Care (NIC), a 501(c)(3) organization, works to enable access and choice by providing data, analytics, and connections that bring together investors and providers. The organization delivers the most trusted, objective, and timely insights and implications derived from its analytics, which benefit from NIC’s affiliation with NIC MAP Vision, the leading provider of comprehensive market data for senior housing and skilled nursing properties. NIC events, which include the industry’s premiere conferences, provide sector stakeholders with opportunities to convene, network, and drive thought-leadership through high-quality educational programming. To see all that NIC offers, visit nic.org.
NIC MAP Vision gives operators, lenders, investors, developers, and owners unparalleled market data for the seniors housing and care sector.