
Analysis of Senior Housing Market Construction Cycle Timelines
June 22, 2023
What is affecting current construction cycles in the senior housing market?
To give industry stakeholders a chance to react to new developments and make better-informed decisions, NIC MAP Vision offers senior housing market data that provides a better view into more construction projects.
3 Factors Affecting Senior Housing Construction Cycles
After analyzing the economic factors and associated demographics, recent NIC MAP data indicates:
- An overall positive trend of increasing construction periods.
- Project scale, unit count, property type, and sector affect the time it takes to complete a senior housing project.
- Senior housing construction cycles differ based on the state, region, and metro area of the United States.
1. Property construction has added additional time to completion compared to a decade ago. Ten years ago, senior housing property construction took a median number of five quarters to complete. Before the pandemic, low barrier-to-entry markets were experiencing oversupply concerns, and high barrier-to-entry markets were timely to pursue. However, in 2021 and 2022, it took eight quarters to complete a senior housing or nursing care property. Currently, developers and investors will have to work through rising construction and labor costs related to their development projects.

Chart #1: Median Number of Quarters for Construction Completion by Year Property Opened
Source: NIC MAP data, powered by NIC MAP Vision
2. The number of units a construction project has directly impacted the construction cycle.
Generally, it takes less time to complete a smaller construction project. While the gap in project scale remains, historical senior housing market data points to increasing construction periods for all projects regardless of the number of units:
- Before 2020, the median construction cycle was five quarters for properties under 100 total units and eight quarters for properties with more than 200 total units.
- From 2020 to 2022, however, the median construction cycle was seven quarters for properties under 100 total units compared to nine quarters for properties with more than 200 units.
In the senior housing market:
- Majority Independent Living projects take slightly longer than Majority Assisted Living projects.
- Continuing Care Retirement Communities (CCRCs) take longer than Senior Housing or Nursing Care projects.
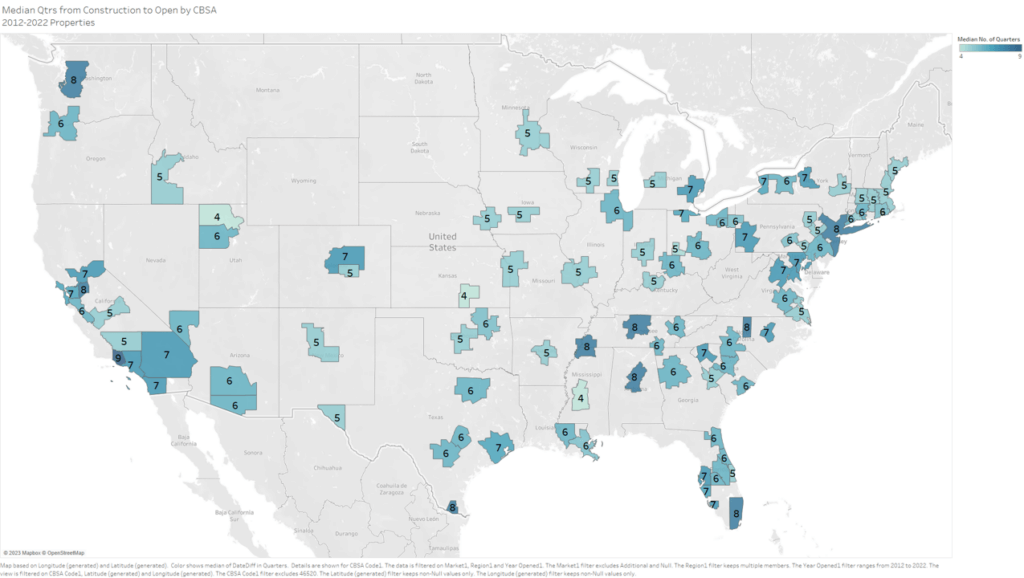
3. Construction cycles differ by state, region, and metropolitan areas.
- Metropolitan markets in the Pacific and Mid-Atlantic regions of the United States have had longer construction cycles compared to the South and Midwest regions.
- Specific metropolitan areas (MSAs) of the country have had longer construction cycles. These include New York, NY; Seattle, WA; Miami, FL; Washington, DC; and many primary and secondary metros in California.
Construction cycle differences are due in part to a variety of factors, such as:
Availability of Development Opportunities in High-Density Markets
Urban centers and densely populated areas such as New York and northern California simply have less space available for senior housing development. NIC MAP Vision occupancy data indicates that these markets have high sustained occupancy rates, steady rent increases, and proportionally less development activity. To enter these markets, developers often elect to invest in an existing property rather than develop a new one. By contrast, areas with suburban population growth, like in the South and Midwest, have more actionable land for development, which easily meets the demand for new senior housing.
Regulatory and Financial Barriers to Entry
Federal, state, and local governmental regulations, union labor requirements and generalized high labor costs, and infrastructure challenges of urban infill markets could lengthen a construction cycle and lead to more time required for a groundbreaking as opposed to an investment in existing construction.
It can be financially more realistic for investors and developers to build horizontally in a suburban market than vertically in a metropolitan area. As a result, they can quickly and easily enter suburban markets in the South and Midwest, which is why markets like Houston and Atlanta continue to have oversupply concerns despite historic absorption (demand).
Ready to Try NIC MAP Vision Yourself?
If you want clarity around senior housing market construction cycles and how they can affect your senior housing projects, schedule a demo with one of our product experts for a detailed explanation of how our construction and senior housing market data can help support your business and save you time in an increasingly competitive market.
NIC MAP Vision gives operators, lenders, investors, developers, and owners unparalleled market data for the seniors housing and care sector.